29
/es/
es
AIzaSyAYiBZKx7MnpbEhh9jyipgxe19OcubqV5w
April 1, 2024
47360
Lower middle income
LMC
false
2
1
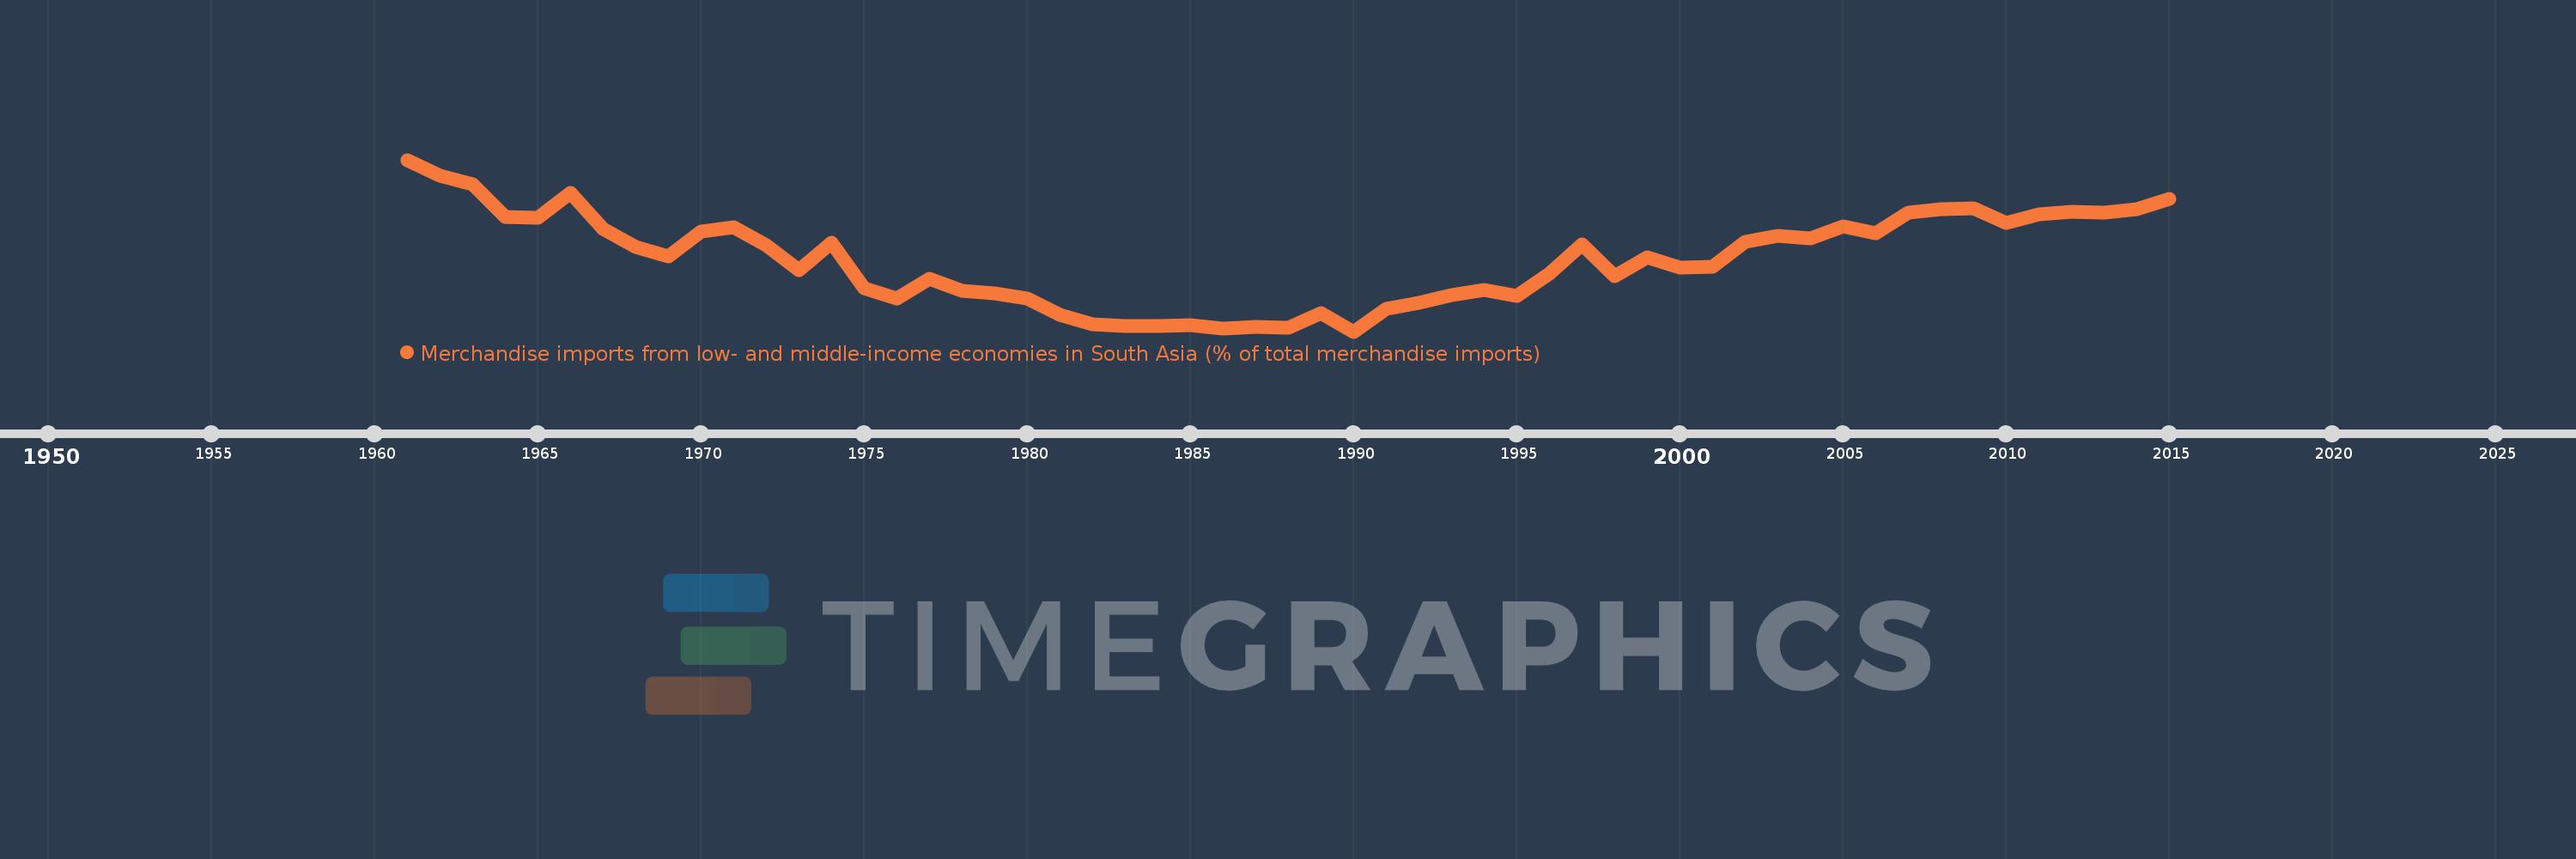
Merchandise imports from low- and middle-income economies in South Asia (% of total merchandise imports)
2015,2014,2013,2012,2011,2010,2009,2008,2007,2006,2005,2004,2003,2002,2001,2000,1999,1998,1997,1996,1995,1994,1993,1992,1991,1990,1989,1988,1987,1986,1985,1984,1983,1982,1981,1980,1979,1978,1977,1976,1975,1974,1973,1972,1971,1970,1969,1968,1967,1966,1965,1964,1963,1962,1961
Estas estadísticas en otros países:
AfghanistanAlbaniaAlgeriaAngolaAntigua and BarbudaArab WorldArgentinaArmeniaArubaAustraliaAustriaAzerbaijanBahamas, TheBahrainBangladeshBarbadosBelarusBelgiumBelizeBeninBermudaBoliviaBrazilBrunei DarussalamBulgariaBurkina FasoBurundiCabo VerdeCambodiaCameroonCanadaCaribbean small statesCentral African RepublicCentral Europe and the BalticsChadChileChinaColombiaCongo, Dem. Rep.Congo, Rep.Costa RicaCote d'IvoireCroatiaCubaCyprusCzech RepublicDenmarkDjiboutiDominicaDominican RepublicEarly-demographic dividendEast Asia & PacificEast Asia & Pacific (excluding high income)East Asia & Pacific (IDA & IBRD countries)EcuadorEgypt, Arab Rep.El SalvadorEstoniaEthiopiaEuro areaEurope & Central AsiaEurope & Central Asia (excluding high income)Europe & Central Asia (IDA & IBRD countries)European UnionFaroe IslandsFijiFinlandFragile and conflict affected situationsFranceGabonGambia, TheGeorgiaGermanyGhanaGibraltarGreeceGreenlandGrenadaGuatemalaGuineaGuyanaHaitiHeavily indebted poor countries (HIPC)High incomeHondurasHong Kong SAR, ChinaHungaryIBRD onlyIcelandIDA & IBRD totalIDA blendIDA onlyIDA totalIndiaIndonesiaIran, Islamic Rep.IraqIrelandIsraelItalyJamaicaJapanJordanKazakhstanKenyaKiribatiKorea, Dem. People’s Rep.Korea, Rep.KosovoKuwaitKyrgyz RepublicLao PDRLate-demographic dividendLatin America & Caribbean Latin America & Caribbean (excluding high income)Latin America & the Caribbean (IDA & IBRD countries)LatviaLeast developed countries: UN classificationLebanonLiberiaLibyaLithuaniaLow & middle incomeLow incomeLower middle incomeLuxembourgMacao SAR, ChinaMacedonia, FYRMadagascarMalawiMalaysiaMaldivesMaliMaltaMauritaniaMauritiusMexicoMiddle East & North AfricaMiddle East & North Africa (excluding high income)Middle East & North Africa (IDA & IBRD countries)Middle incomeMoldovaMongoliaMontenegroMoroccoMozambiqueMyanmarNauruNepalNetherlandsNew CaledoniaNew ZealandNicaraguaNigerNigeriaNorth AmericaNorwayOECD membersOmanOther small statesPacific island small statesPakistanPanamaPapua New GuineaParaguayPeruPhilippinesPolandPortugalPost-demographic dividendPre-demographic dividendQatarRomaniaRussian FederationRwandaSamoaSaudi ArabiaSenegalSerbiaSeychellesSierra LeoneSingaporeSlovak RepublicSloveniaSmall statesSolomon IslandsSomaliaSouth AfricaSouth AsiaSouth Asia (IDA & IBRD)SpainSri LankaSt. Kitts and NevisSt. LuciaSt. Vincent and the GrenadinesSub-Saharan Africa Sub-Saharan Africa (excluding high income)Sub-Saharan Africa (IDA & IBRD countries)SudanSurinameSwedenSwitzerlandSyrian Arab RepublicTajikistanTanzaniaThailandTogoTongaTrinidad and TobagoTunisiaTurkeyTurkmenistanUgandaUkraineUnited Arab EmiratesUnited KingdomUnited StatesUpper middle incomeUruguayUzbekistanVanuatuVenezuela, RBVietnamWorldYemen, Rep.ZambiaZimbabwe línea de tiempo (timeline):
En esta escala de tiempo se presenta un gráfico de 1961 y 2015 de Lower middle income. Los datos de 1960 están ausentes. El número de observaciones reales por fecha: 55.
Fuente (nombre):
Indicadores del desarrollo mundial
Fuente (organización):
World Bank staff estimates based data from International Monetary Fund's Direction of Trade database.
Categorías:
Private Sector, Trade
Se ha actualizado:
23 abr 2017 año
Los indicadores de los cambios de valor en los últimos años
Mínimo:
1.056
1 ene 1990 año
Máximo:
3.429
1 ene 1961 año
A la fecha de observación
Valor
Cambio absoluto
El cambio con respecto al valor anterior
1 ene 1961 año
3.429
+3.429
0.0%
1 ene 1962 año
3.211
-0.218
-6.36%
1 ene 1963 año
3.091
-0.12
-3.72%
1 ene 1964 año
2.638
-0.453
-14.66%
1 ene 1965 año
2.632
-0.006
-0.21%
1 ene 1966 año
2.967
+0.335
12.72%
1 ene 1967 año
2.476
-0.492
-16.57%
1 ene 1968 año
2.227
-0.249
-10.05%
1 ene 1969 año
2.099
-0.127
-5.72%
1 ene 1970 año
2.435
+0.335
15.97%
1 ene 1971 año
2.497
+0.062
2.55%
1 ene 1972 año
2.253
-0.244
-9.76%
1 ene 1973 año
1.902
-0.351
-15.6%
1 ene 1974 año
2.279
+0.378
19.86%
1 ene 1975 año
1.661
-0.618
-27.12%
1 ene 1976 año
1.507
-0.154
-9.26%
1 ene 1977 año
1.791
+0.283
18.79%
1 ene 1978 año
1.622
-0.168
-9.41%
1 ene 1979 año
1.588
-0.034
-2.11%
1 ene 1980 año
1.518
-0.069
-4.38%
1 ene 1981 año
1.292
-0.226
-14.89%
1 ene 1982 año
1.157
-0.135
-10.47%
1 ene 1983 año
1.133
-0.024
-2.11%
1 ene 1984 año
1.136
+0.004
0.34%
1 ene 1985 año
1.15
+0.014
1.2%
1 ene 1986 año
1.093
-0.057
-4.97%
1 ene 1987 año
1.118
+0.025
2.26%
1 ene 1988 año
1.114
-0.004
-0.33%
1 ene 1989 año
1.306
+0.193
17.28%
1 ene 1990 año
1.056
-0.25
-19.16%
1 ene 1991 año
1.369
+0.312
29.57%
1 ene 1992 año
1.45
+0.081
5.92%
1 ene 1993 año
1.563
+0.113
7.8%
1 ene 1994 año
1.633
+0.071
4.51%
1 ene 1995 año
1.553
-0.08
-4.91%
1 ene 1996 año
1.86
+0.307
19.77%
1 ene 1997 año
2.26
+0.4
21.53%
1 ene 1998 año
1.819
-0.442
-19.54%
1 ene 1999 año
2.078
+0.26
14.28%
1 ene 2000 año
1.945
-0.133
-6.4%
1 ene 2001 año
1.947
+0.002
0.08%
1 ene 2002 año
2.3
+0.353
18.12%
1 ene 2003 año
2.379
+0.08
3.46%
1 ene 2004 año
2.349
-0.03
-1.27%
1 ene 2005 año
2.511
+0.162
6.9%
1 ene 2006 año
2.419
-0.092
-3.68%
1 ene 2007 año
2.698
+0.279
11.55%
1 ene 2008 año
2.746
+0.048
1.77%
1 ene 2009 año
2.764
+0.018
0.64%
1 ene 2010 año
2.552
-0.212
-7.66%
1 ene 2011 año
2.672
+0.12
4.69%
1 ene 2012 año
2.707
+0.035
1.31%
1 ene 2013 año
2.696
-0.011
-0.41%
1 ene 2014 año
2.746
+0.05
1.87%
1 ene 2015 año
2.895
+0.149
5.43%
Ranking de los países por los datos estadísticos actuales


Comentarios: