29
/es/
es
AIzaSyAYiBZKx7MnpbEhh9jyipgxe19OcubqV5w
April 1, 2024
55719
Pre-demographic dividend
PRE
false
2
1
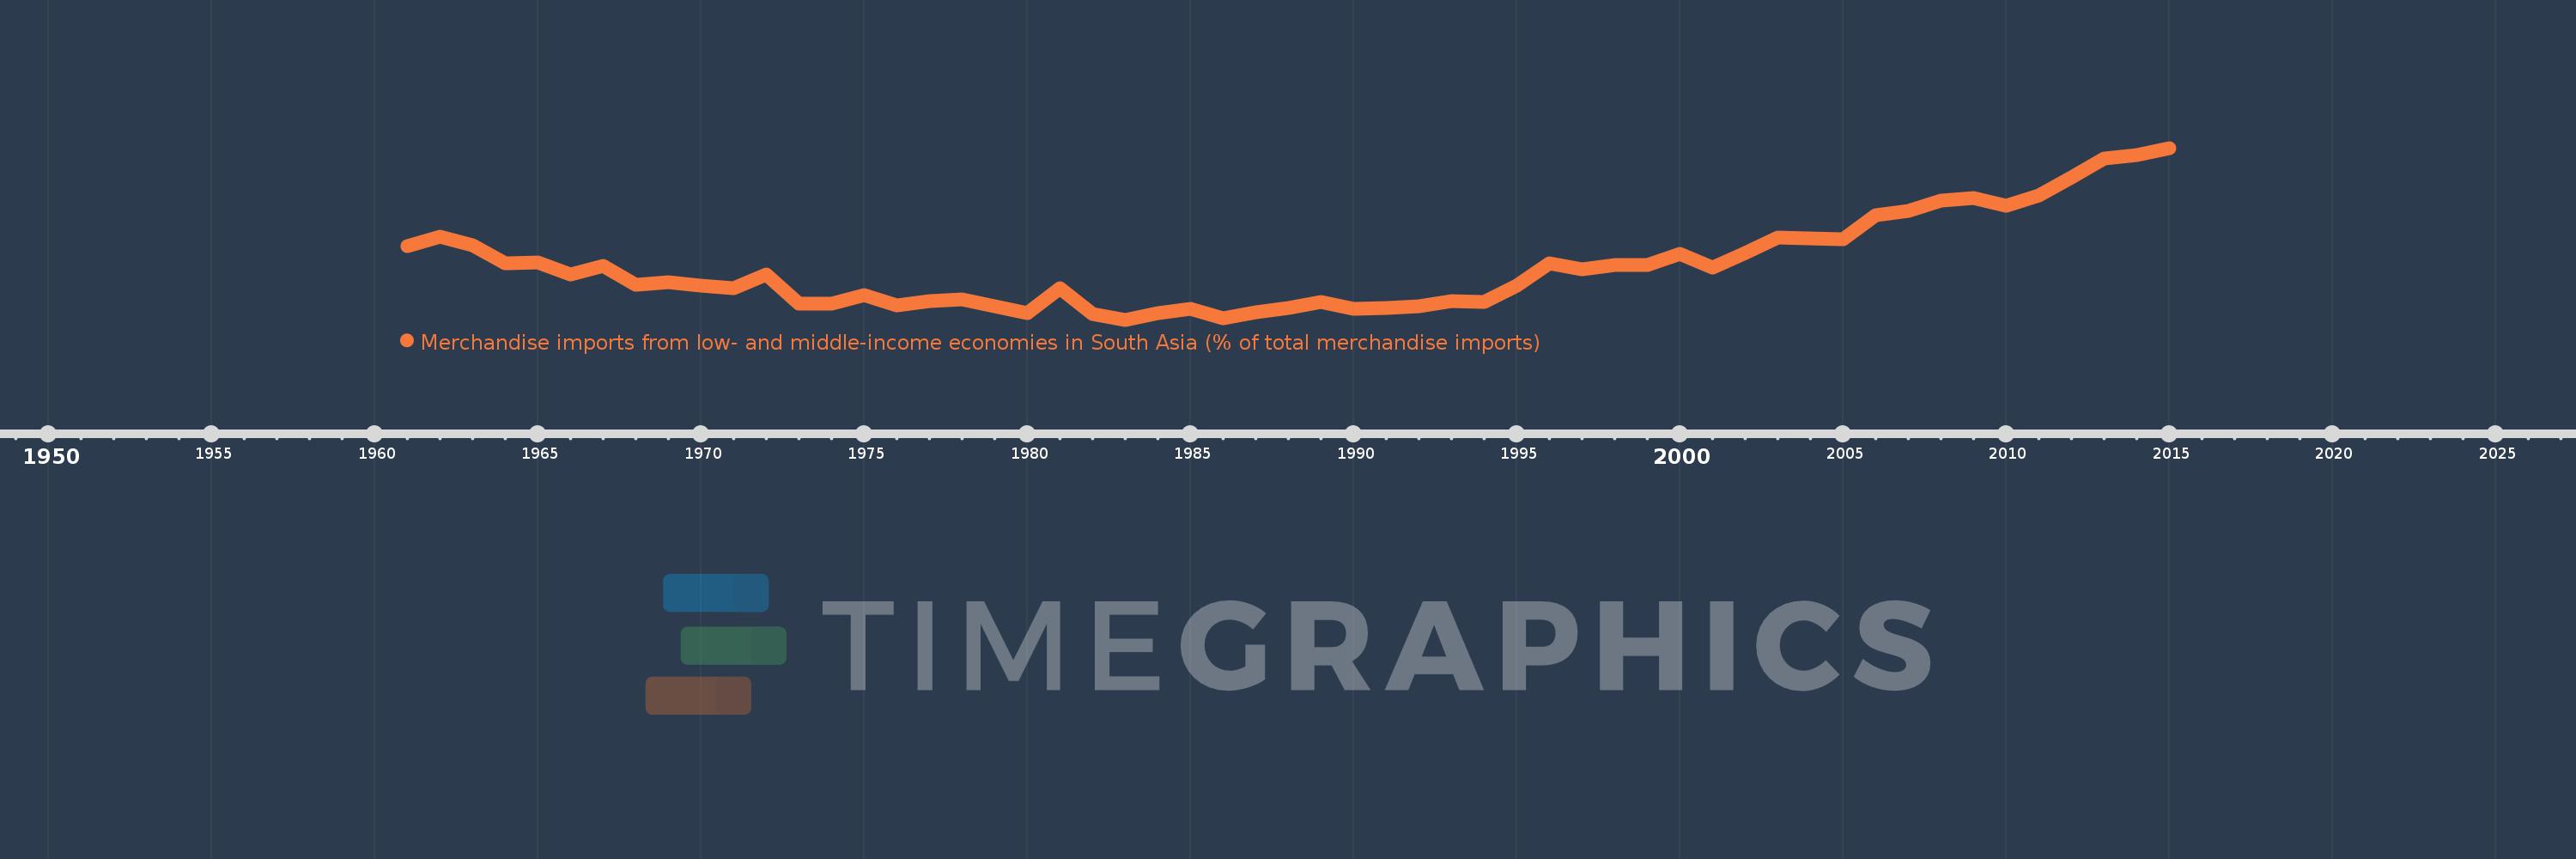
Merchandise imports from low- and middle-income economies in South Asia (% of total merchandise imports)
2015,2014,2013,2012,2011,2010,2009,2008,2007,2006,2005,2004,2003,2002,2001,2000,1999,1998,1997,1996,1995,1994,1993,1992,1991,1990,1989,1988,1987,1986,1985,1984,1983,1982,1981,1980,1979,1978,1977,1976,1975,1974,1973,1972,1971,1970,1969,1968,1967,1966,1965,1964,1963,1962,1961
Estas estadísticas en otros países:
AfghanistanAlbaniaAlgeriaAngolaAntigua and BarbudaArab WorldArgentinaArmeniaArubaAustraliaAustriaAzerbaijanBahamas, TheBahrainBangladeshBarbadosBelarusBelgiumBelizeBeninBermudaBoliviaBrazilBrunei DarussalamBulgariaBurkina FasoBurundiCabo VerdeCambodiaCameroonCanadaCaribbean small statesCentral African RepublicCentral Europe and the BalticsChadChileChinaColombiaCongo, Dem. Rep.Congo, Rep.Costa RicaCote d'IvoireCroatiaCubaCyprusCzech RepublicDenmarkDjiboutiDominicaDominican RepublicEarly-demographic dividendEast Asia & PacificEast Asia & Pacific (excluding high income)East Asia & Pacific (IDA & IBRD countries)EcuadorEgypt, Arab Rep.El SalvadorEstoniaEthiopiaEuro areaEurope & Central AsiaEurope & Central Asia (excluding high income)Europe & Central Asia (IDA & IBRD countries)European UnionFaroe IslandsFijiFinlandFragile and conflict affected situationsFranceGabonGambia, TheGeorgiaGermanyGhanaGibraltarGreeceGreenlandGrenadaGuatemalaGuineaGuyanaHaitiHeavily indebted poor countries (HIPC)High incomeHondurasHong Kong SAR, ChinaHungaryIBRD onlyIcelandIDA & IBRD totalIDA blendIDA onlyIDA totalIndiaIndonesiaIran, Islamic Rep.IraqIrelandIsraelItalyJamaicaJapanJordanKazakhstanKenyaKiribatiKorea, Dem. People’s Rep.Korea, Rep.KosovoKuwaitKyrgyz RepublicLao PDRLate-demographic dividendLatin America & Caribbean Latin America & Caribbean (excluding high income)Latin America & the Caribbean (IDA & IBRD countries)LatviaLeast developed countries: UN classificationLebanonLiberiaLibyaLithuaniaLow & middle incomeLow incomeLower middle incomeLuxembourgMacao SAR, ChinaMacedonia, FYRMadagascarMalawiMalaysiaMaldivesMaliMaltaMauritaniaMauritiusMexicoMiddle East & North AfricaMiddle East & North Africa (excluding high income)Middle East & North Africa (IDA & IBRD countries)Middle incomeMoldovaMongoliaMontenegroMoroccoMozambiqueMyanmarNauruNepalNetherlandsNew CaledoniaNew ZealandNicaraguaNigerNigeriaNorth AmericaNorwayOECD membersOmanOther small statesPacific island small statesPakistanPanamaPapua New GuineaParaguayPeruPhilippinesPolandPortugalPost-demographic dividendPre-demographic dividendQatarRomaniaRussian FederationRwandaSamoaSaudi ArabiaSenegalSerbiaSeychellesSierra LeoneSingaporeSlovak RepublicSloveniaSmall statesSolomon IslandsSomaliaSouth AfricaSouth AsiaSouth Asia (IDA & IBRD)SpainSri LankaSt. Kitts and NevisSt. LuciaSt. Vincent and the GrenadinesSub-Saharan Africa Sub-Saharan Africa (excluding high income)Sub-Saharan Africa (IDA & IBRD countries)SudanSurinameSwedenSwitzerlandSyrian Arab RepublicTajikistanTanzaniaThailandTogoTongaTrinidad and TobagoTunisiaTurkeyTurkmenistanUgandaUkraineUnited Arab EmiratesUnited KingdomUnited StatesUpper middle incomeUruguayUzbekistanVanuatuVenezuela, RBVietnamWorldYemen, Rep.ZambiaZimbabwe línea de tiempo (timeline):
En esta escala de tiempo se presenta un gráfico de 1961 y 2015 de Pre-demographic dividend. Los datos de 1960 están ausentes. El número de observaciones reales por fecha: 55.
Fuente (nombre):
Indicadores del desarrollo mundial
Fuente (organización):
World Bank staff estimates based data from International Monetary Fund's Direction of Trade database.
Categorías:
Private Sector, Trade
Se ha actualizado:
23 abr 2017 año
Los indicadores de los cambios de valor en los últimos años
Mínimo:
1.181
1 ene 1983 año
Máximo:
7.276
1 ene 2015 año
A la fecha de observación
Valor
Cambio absoluto
El cambio con respecto al valor anterior
1 ene 1961 año
3.801
+3.801
0.0%
1 ene 1962 año
4.129
+0.328
8.64%
1 ene 1963 año
3.809
-0.32
-7.75%
1 ene 1964 año
3.17
-0.64
-16.79%
1 ene 1965 año
3.228
+0.058
1.84%
1 ene 1966 año
2.79
-0.438
-13.57%
1 ene 1967 año
3.088
+0.298
10.7%
1 ene 1968 año
2.423
-0.665
-21.54%
1 ene 1969 año
2.501
+0.078
3.21%
1 ene 1970 año
2.404
-0.097
-3.87%
1 ene 1971 año
2.301
-0.103
-4.3%
1 ene 1972 año
2.785
+0.485
21.06%
1 ene 1973 año
1.75
-1.035
-37.17%
1 ene 1974 año
1.745
-0.005
-0.31%
1 ene 1975 año
2.062
+0.317
18.17%
1 ene 1976 año
1.705
-0.356
-17.28%
1 ene 1977 año
1.853
+0.148
8.65%
1 ene 1978 año
1.904
+0.051
2.77%
1 ene 1979 año
1.646
-0.259
-13.58%
1 ene 1980 año
1.42
-0.226
-13.73%
1 ene 1981 año
2.285
+0.865
60.93%
1 ene 1982 año
1.378
-0.907
-39.71%
1 ene 1983 año
1.181
-0.197
-14.29%
1 ene 1984 año
1.424
+0.243
20.6%
1 ene 1985 año
1.563
+0.139
9.78%
1 ene 1986 año
1.228
-0.335
-21.43%
1 ene 1987 año
1.448
+0.219
17.87%
1 ene 1988 año
1.611
+0.163
11.28%
1 ene 1989 año
1.808
+0.198
12.26%
1 ene 1990 año
1.563
-0.245
-13.57%
1 ene 1991 año
1.603
+0.04
2.53%
1 ene 1992 año
1.649
+0.047
2.92%
1 ene 1993 año
1.851
+0.202
12.24%
1 ene 1994 año
1.798
-0.053
-2.85%
1 ene 1995 año
2.387
+0.589
32.75%
1 ene 1996 año
3.197
+0.81
33.92%
1 ene 1997 año
2.98
-0.217
-6.78%
1 ene 1998 año
3.126
+0.146
4.89%
1 ene 1999 año
3.129
+0.003
0.1%
1 ene 2000 año
3.529
+0.4
12.79%
1 ene 2001 año
3.037
-0.492
-13.95%
1 ene 2002 año
3.548
+0.511
16.84%
1 ene 2003 año
4.107
+0.559
15.75%
1 ene 2004 año
4.06
-0.047
-1.14%
1 ene 2005 año
4.041
-0.019
-0.46%
1 ene 2006 año
4.89
+0.849
21.0%
1 ene 2007 año
5.028
+0.138
2.83%
1 ene 2008 año
5.394
+0.366
7.28%
1 ene 2009 año
5.514
+0.12
2.22%
1 ene 2010 año
5.212
-0.302
-5.48%
1 ene 2011 año
5.58
+0.368
7.06%
1 ene 2012 año
6.216
+0.636
11.4%
1 ene 2013 año
6.903
+0.686
11.04%
1 ene 2014 año
7.036
+0.134
1.94%
1 ene 2015 año
7.276
+0.239
3.4%
Ranking de los países por los datos estadísticos actuales


Comentarios: