29
/es/
es
AIzaSyAYiBZKx7MnpbEhh9jyipgxe19OcubqV5w
April 1, 2024
282576
Vietnam
VNM
true
2
1
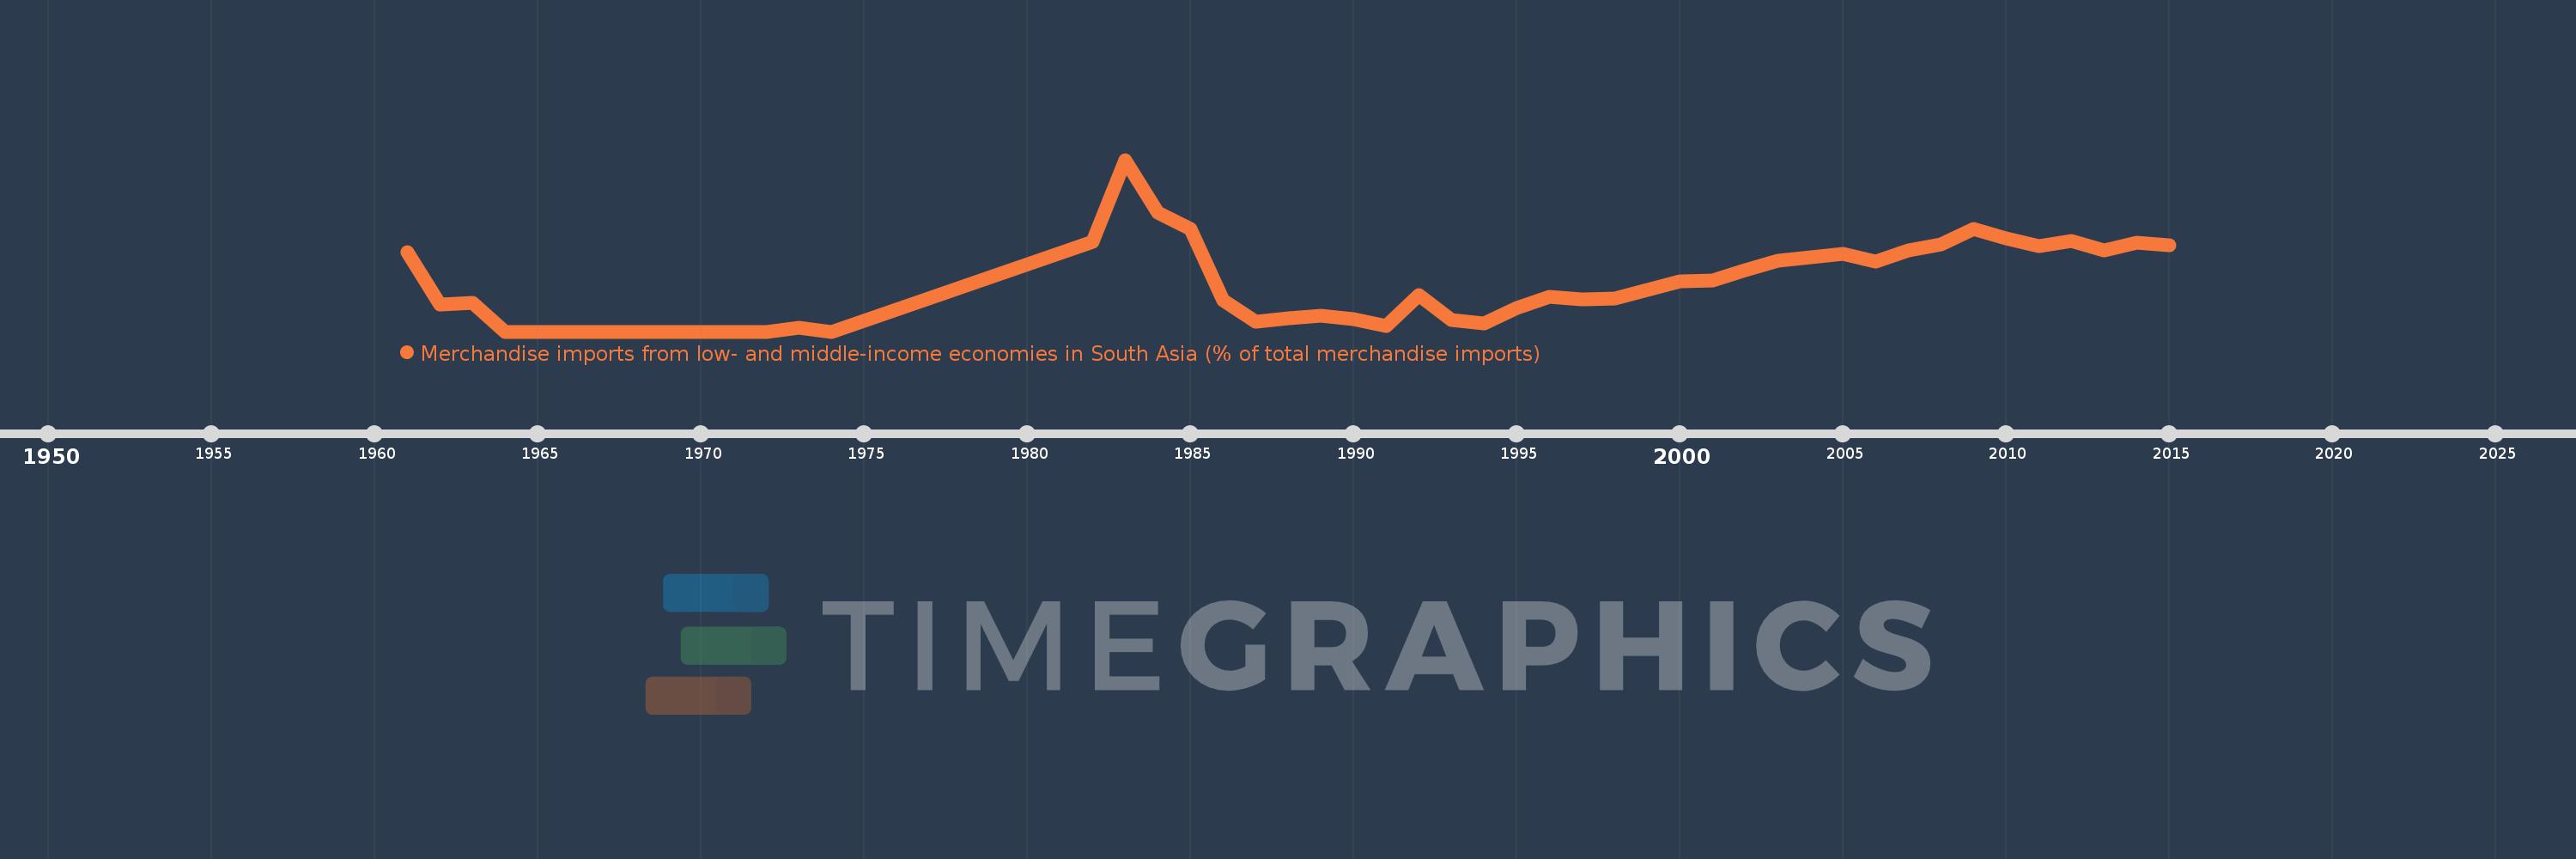
Merchandise imports from low- and middle-income economies in South Asia (% of total merchandise imports)
2015,2014,2013,2012,2011,2010,2009,2008,2007,2006,2005,2004,2003,2002,2001,2000,1999,1998,1997,1996,1995,1994,1993,1992,1991,1990,1989,1988,1987,1986,1985,1984,1983,1982,1974,1973,1972,1971,1970,1969,1968,1967,1966,1965,1964,1963,1962,1961
Estas estadísticas en otros países:
AfghanistanAlbaniaAlgeriaAngolaAntigua and BarbudaArab WorldArgentinaArmeniaArubaAustraliaAustriaAzerbaijanBahamas, TheBahrainBangladeshBarbadosBelarusBelgiumBelizeBeninBermudaBoliviaBrazilBrunei DarussalamBulgariaBurkina FasoBurundiCabo VerdeCambodiaCameroonCanadaCaribbean small statesCentral African RepublicCentral Europe and the BalticsChadChileChinaColombiaCongo, Dem. Rep.Congo, Rep.Costa RicaCote d'IvoireCroatiaCubaCyprusCzech RepublicDenmarkDjiboutiDominicaDominican RepublicEarly-demographic dividendEast Asia & PacificEast Asia & Pacific (excluding high income)East Asia & Pacific (IDA & IBRD countries)EcuadorEgypt, Arab Rep.El SalvadorEstoniaEthiopiaEuro areaEurope & Central AsiaEurope & Central Asia (excluding high income)Europe & Central Asia (IDA & IBRD countries)European UnionFaroe IslandsFijiFinlandFragile and conflict affected situationsFranceGabonGambia, TheGeorgiaGermanyGhanaGibraltarGreeceGreenlandGrenadaGuatemalaGuineaGuyanaHaitiHeavily indebted poor countries (HIPC)High incomeHondurasHong Kong SAR, ChinaHungaryIBRD onlyIcelandIDA & IBRD totalIDA blendIDA onlyIDA totalIndiaIndonesiaIran, Islamic Rep.IraqIrelandIsraelItalyJamaicaJapanJordanKazakhstanKenyaKiribatiKorea, Dem. People’s Rep.Korea, Rep.KosovoKuwaitKyrgyz RepublicLao PDRLate-demographic dividendLatin America & Caribbean Latin America & Caribbean (excluding high income)Latin America & the Caribbean (IDA & IBRD countries)LatviaLeast developed countries: UN classificationLebanonLiberiaLibyaLithuaniaLow & middle incomeLow incomeLower middle incomeLuxembourgMacao SAR, ChinaMacedonia, FYRMadagascarMalawiMalaysiaMaldivesMaliMaltaMauritaniaMauritiusMexicoMiddle East & North AfricaMiddle East & North Africa (excluding high income)Middle East & North Africa (IDA & IBRD countries)Middle incomeMoldovaMongoliaMontenegroMoroccoMozambiqueMyanmarNauruNepalNetherlandsNew CaledoniaNew ZealandNicaraguaNigerNigeriaNorth AmericaNorwayOECD membersOmanOther small statesPacific island small statesPakistanPanamaPapua New GuineaParaguayPeruPhilippinesPolandPortugalPost-demographic dividendPre-demographic dividendQatarRomaniaRussian FederationRwandaSamoaSaudi ArabiaSenegalSerbiaSeychellesSierra LeoneSingaporeSlovak RepublicSloveniaSmall statesSolomon IslandsSomaliaSouth AfricaSouth AsiaSouth Asia (IDA & IBRD)SpainSri LankaSt. Kitts and NevisSt. LuciaSt. Vincent and the GrenadinesSub-Saharan Africa Sub-Saharan Africa (excluding high income)Sub-Saharan Africa (IDA & IBRD countries)SudanSurinameSwedenSwitzerlandSyrian Arab RepublicTajikistanTanzaniaThailandTogoTongaTrinidad and TobagoTunisiaTurkeyTurkmenistanUgandaUkraineUnited Arab EmiratesUnited KingdomUnited StatesUpper middle incomeUruguayUzbekistanVanuatuVenezuela, RBVietnamWorldYemen, Rep.ZambiaZimbabwe línea de tiempo (timeline):
En esta escala de tiempo se presenta un gráfico de 1961 y 2015 de Vietnam. Los datos de 1960 están ausentes. El número de observaciones reales por fecha: 48.
Fuente (nombre):
Indicadores del desarrollo mundial
Fuente (organización):
World Bank staff estimates based data from International Monetary Fund's Direction of Trade database.
Categorías:
Private Sector, Trade
Se ha actualizado:
23 abr 2017 año
Los indicadores de los cambios de valor en los últimos años
Máximo:
4.527
1 ene 1983 año
A la fecha de observación
Valor
Cambio absoluto
El cambio con respecto al valor anterior
1 ene 1961 año
2.087
+2.087
0.0%
1 ene 1962 año
0.712
-1.375
-65.89%
1 ene 1963 año
0.759
+0.047
6.63%
1 ene 1964 año
0.0
-0.759
-100.0%
1 ene 1973 año
0.097
+0.097
%
1 ene 1974 año
0.0
-0.097
-100.0%
1 ene 1982 año
2.36
+2.36
%
1 ene 1983 año
4.527
+2.167
91.81%
1 ene 1984 año
3.134
-1.393
-30.77%
1 ene 1985 año
2.7
-0.434
-13.85%
1 ene 1986 año
0.82
-1.88
-69.64%
1 ene 1987 año
0.269
-0.551
-67.19%
1 ene 1988 año
0.346
+0.077
28.81%
1 ene 1989 año
0.428
+0.082
23.69%
1 ene 1990 año
0.331
-0.098
-22.78%
1 ene 1991 año
0.152
-0.179
-53.99%
1 ene 1992 año
0.965
+0.813
533.85%
1 ene 1993 año
0.298
-0.667
-69.13%
1 ene 1994 año
0.215
-0.083
-27.75%
1 ene 1995 año
0.614
+0.398
185.09%
1 ene 1996 año
0.912
+0.298
48.64%
1 ene 1997 año
0.841
-0.071
-7.81%
1 ene 1998 año
0.877
+0.036
4.26%
1 ene 1999 año
1.1
+0.224
25.5%
1 ene 2000 año
1.321
+0.22
20.03%
1 ene 2001 año
1.339
+0.018
1.36%
1 ene 2002 año
1.612
+0.274
20.46%
1 ene 2003 año
1.862
+0.249
15.46%
1 ene 2004 año
1.963
+0.101
5.43%
1 ene 2005 año
2.039
+0.076
3.89%
1 ene 2006 año
1.841
-0.198
-9.73%
1 ene 2007 año
2.134
+0.294
15.95%
1 ene 2008 año
2.306
+0.172
8.05%
1 ene 2009 año
2.711
+0.405
17.56%
1 ene 2010 año
2.454
-0.257
-9.48%
1 ene 2011 año
2.245
-0.209
-8.52%
1 ene 2012 año
2.394
+0.149
6.65%
1 ene 2013 año
2.129
-0.265
-11.08%
1 ene 2014 año
2.346
+0.217
10.19%
1 ene 2015 año
2.267
-0.079
-3.37%
Ranking de los países por los datos estadísticos actuales


Comentarios: