29
/es/
es
AIzaSyAYiBZKx7MnpbEhh9jyipgxe19OcubqV5w
April 1, 2024
31831
Europe & Central Asia (excluding high income)
ECA
false
2
1
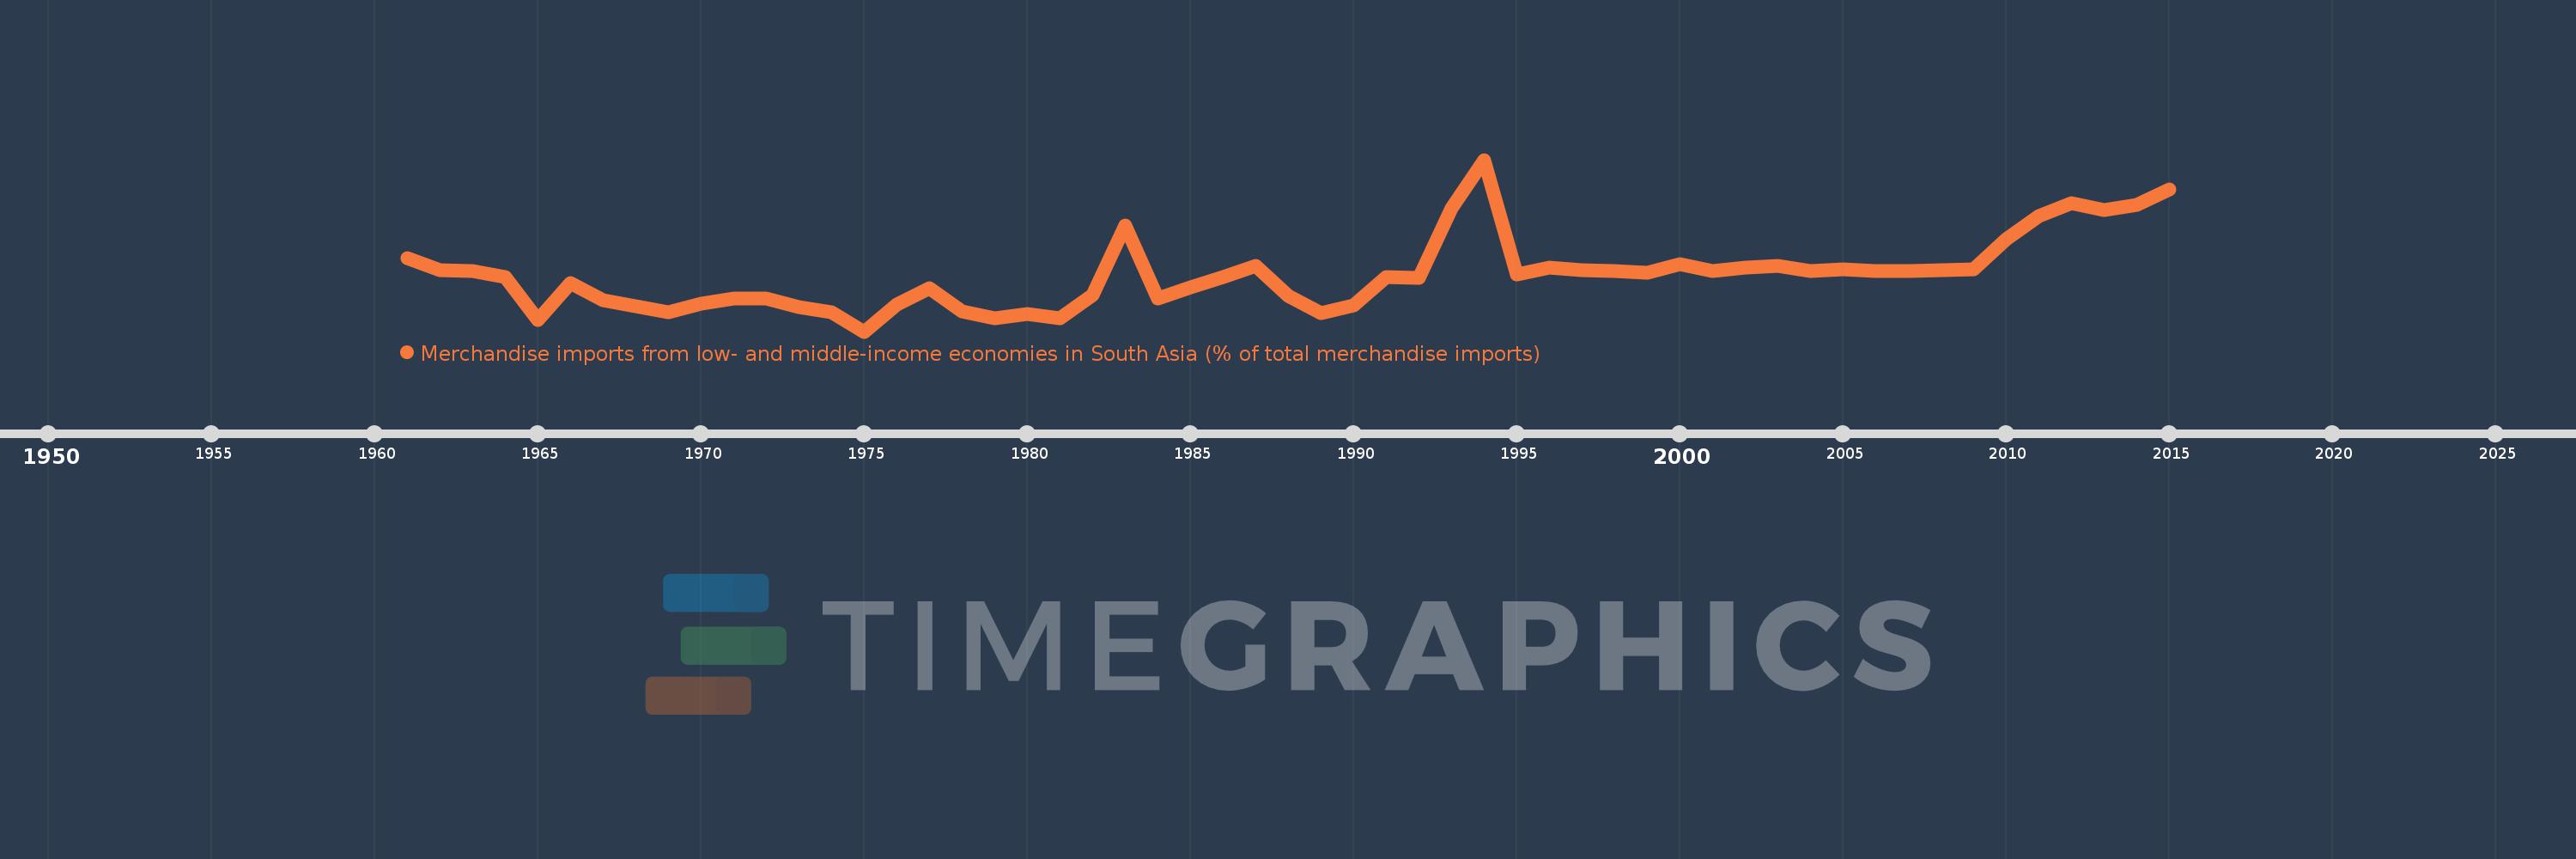
Merchandise imports from low- and middle-income economies in South Asia (% of total merchandise imports)
2015,2014,2013,2012,2011,2010,2009,2008,2007,2006,2005,2004,2003,2002,2001,2000,1999,1998,1997,1996,1995,1994,1993,1992,1991,1990,1989,1988,1987,1986,1985,1984,1983,1982,1981,1980,1979,1978,1977,1976,1975,1974,1973,1972,1971,1970,1969,1968,1967,1966,1965,1964,1963,1962,1961
Estas estadísticas en otros países:
AfghanistanAlbaniaAlgeriaAngolaAntigua and BarbudaArab WorldArgentinaArmeniaArubaAustraliaAustriaAzerbaijanBahamas, TheBahrainBangladeshBarbadosBelarusBelgiumBelizeBeninBermudaBoliviaBrazilBrunei DarussalamBulgariaBurkina FasoBurundiCabo VerdeCambodiaCameroonCanadaCaribbean small statesCentral African RepublicCentral Europe and the BalticsChadChileChinaColombiaCongo, Dem. Rep.Congo, Rep.Costa RicaCote d'IvoireCroatiaCubaCyprusCzech RepublicDenmarkDjiboutiDominicaDominican RepublicEarly-demographic dividendEast Asia & PacificEast Asia & Pacific (excluding high income)East Asia & Pacific (IDA & IBRD countries)EcuadorEgypt, Arab Rep.El SalvadorEstoniaEthiopiaEuro areaEurope & Central AsiaEurope & Central Asia (excluding high income)Europe & Central Asia (IDA & IBRD countries)European UnionFaroe IslandsFijiFinlandFragile and conflict affected situationsFranceGabonGambia, TheGeorgiaGermanyGhanaGibraltarGreeceGreenlandGrenadaGuatemalaGuineaGuyanaHaitiHeavily indebted poor countries (HIPC)High incomeHondurasHong Kong SAR, ChinaHungaryIBRD onlyIcelandIDA & IBRD totalIDA blendIDA onlyIDA totalIndiaIndonesiaIran, Islamic Rep.IraqIrelandIsraelItalyJamaicaJapanJordanKazakhstanKenyaKiribatiKorea, Dem. People’s Rep.Korea, Rep.KosovoKuwaitKyrgyz RepublicLao PDRLate-demographic dividendLatin America & Caribbean Latin America & Caribbean (excluding high income)Latin America & the Caribbean (IDA & IBRD countries)LatviaLeast developed countries: UN classificationLebanonLiberiaLibyaLithuaniaLow & middle incomeLow incomeLower middle incomeLuxembourgMacao SAR, ChinaMacedonia, FYRMadagascarMalawiMalaysiaMaldivesMaliMaltaMauritaniaMauritiusMexicoMiddle East & North AfricaMiddle East & North Africa (excluding high income)Middle East & North Africa (IDA & IBRD countries)Middle incomeMoldovaMongoliaMontenegroMoroccoMozambiqueMyanmarNauruNepalNetherlandsNew CaledoniaNew ZealandNicaraguaNigerNigeriaNorth AmericaNorwayOECD membersOmanOther small statesPacific island small statesPakistanPanamaPapua New GuineaParaguayPeruPhilippinesPolandPortugalPost-demographic dividendPre-demographic dividendQatarRomaniaRussian FederationRwandaSamoaSaudi ArabiaSenegalSerbiaSeychellesSierra LeoneSingaporeSlovak RepublicSloveniaSmall statesSolomon IslandsSomaliaSouth AfricaSouth AsiaSouth Asia (IDA & IBRD)SpainSri LankaSt. Kitts and NevisSt. LuciaSt. Vincent and the GrenadinesSub-Saharan Africa Sub-Saharan Africa (excluding high income)Sub-Saharan Africa (IDA & IBRD countries)SudanSurinameSwedenSwitzerlandSyrian Arab RepublicTajikistanTanzaniaThailandTogoTongaTrinidad and TobagoTunisiaTurkeyTurkmenistanUgandaUkraineUnited Arab EmiratesUnited KingdomUnited StatesUpper middle incomeUruguayUzbekistanVanuatuVenezuela, RBVietnamWorldYemen, Rep.ZambiaZimbabwe línea de tiempo (timeline):
En esta escala de tiempo se presenta un gráfico de 1961 y 2015 de Europe & Central Asia (excluding high income). Los datos de 1960 están ausentes. El número de observaciones reales por fecha: 55.
Fuente (nombre):
Indicadores del desarrollo mundial
Fuente (organización):
World Bank staff estimates based data from International Monetary Fund's Direction of Trade database.
Categorías:
Private Sector, Trade
Se ha actualizado:
23 abr 2017 año
Los indicadores de los cambios de valor en los últimos años
Mínimo:
0.368
1 ene 1975 año
Máximo:
2.135
1 ene 1994 año
A la fecha de observación
Valor
Cambio absoluto
El cambio con respecto al valor anterior
1 ene 1961 año
1.124
+1.124
0.0%
1 ene 1962 año
1.0
-0.123
-10.98%
1 ene 1963 año
0.991
-0.009
-0.95%
1 ene 1964 año
0.932
-0.059
-5.94%
1 ene 1965 año
0.49
-0.442
-47.42%
1 ene 1966 año
0.866
+0.375
76.61%
1 ene 1967 año
0.689
-0.177
-20.43%
1 ene 1968 año
0.633
-0.056
-8.08%
1 ene 1969 año
0.57
-0.063
-9.9%
1 ene 1970 año
0.653
+0.083
14.47%
1 ene 1971 año
0.707
+0.054
8.3%
1 ene 1972 año
0.71
+0.003
0.45%
1 ene 1973 año
0.616
-0.095
-13.33%
1 ene 1974 año
0.568
-0.047
-7.67%
1 ene 1975 año
0.368
-0.2
-35.24%
1 ene 1976 año
0.646
+0.278
75.66%
1 ene 1977 año
0.816
+0.17
26.3%
1 ene 1978 año
0.576
-0.24
-29.44%
1 ene 1979 año
0.506
-0.07
-12.13%
1 ene 1980 año
0.55
+0.043
8.55%
1 ene 1981 año
0.502
-0.047
-8.6%
1 ene 1982 año
0.743
+0.241
47.92%
1 ene 1983 año
1.456
+0.713
95.92%
1 ene 1984 año
0.712
-0.743
-51.06%
1 ene 1985 año
0.823
+0.11
15.46%
1 ene 1986 año
0.926
+0.104
12.61%
1 ene 1987 año
1.042
+0.116
12.49%
1 ene 1988 año
0.738
-0.304
-29.18%
1 ene 1989 año
0.558
-0.18
-24.4%
1 ene 1990 año
0.636
+0.078
14.0%
1 ene 1991 año
0.927
+0.291
45.75%
1 ene 1992 año
0.921
-0.005
-0.58%
1 ene 1993 año
1.634
+0.713
77.4%
1 ene 1994 año
2.135
+0.501
30.63%
1 ene 1995 año
0.957
-1.178
-55.19%
1 ene 1996 año
1.023
+0.066
6.92%
1 ene 1997 año
1.0
-0.023
-2.25%
1 ene 1998 año
0.995
-0.005
-0.52%
1 ene 1999 año
0.971
-0.023
-2.33%
1 ene 2000 año
1.064
+0.092
9.5%
1 ene 2001 año
0.991
-0.072
-6.81%
1 ene 2002 año
1.024
+0.033
3.33%
1 ene 2003 año
1.04
+0.016
1.52%
1 ene 2004 año
0.995
-0.044
-4.27%
1 ene 2005 año
1.007
+0.012
1.21%
1 ene 2006 año
0.988
-0.019
-1.88%
1 ene 2007 año
0.988
0.0
-0.03%
1 ene 2008 año
1.004
+0.015
1.56%
1 ene 2009 año
1.007
+0.003
0.31%
1 ene 2010 año
1.32
+0.314
31.16%
1 ene 2011 año
1.556
+0.235
17.81%
1 ene 2012 año
1.693
+0.137
8.82%
1 ene 2013 año
1.621
-0.071
-4.22%
1 ene 2014 año
1.669
+0.048
2.94%
1 ene 2015 año
1.834
+0.164
9.85%
Ranking de los países por los datos estadísticos actuales


Comentarios: