29
/es/
es
AIzaSyAYiBZKx7MnpbEhh9jyipgxe19OcubqV5w
April 1, 2024
226174
Portugal
PRT
true
2
1
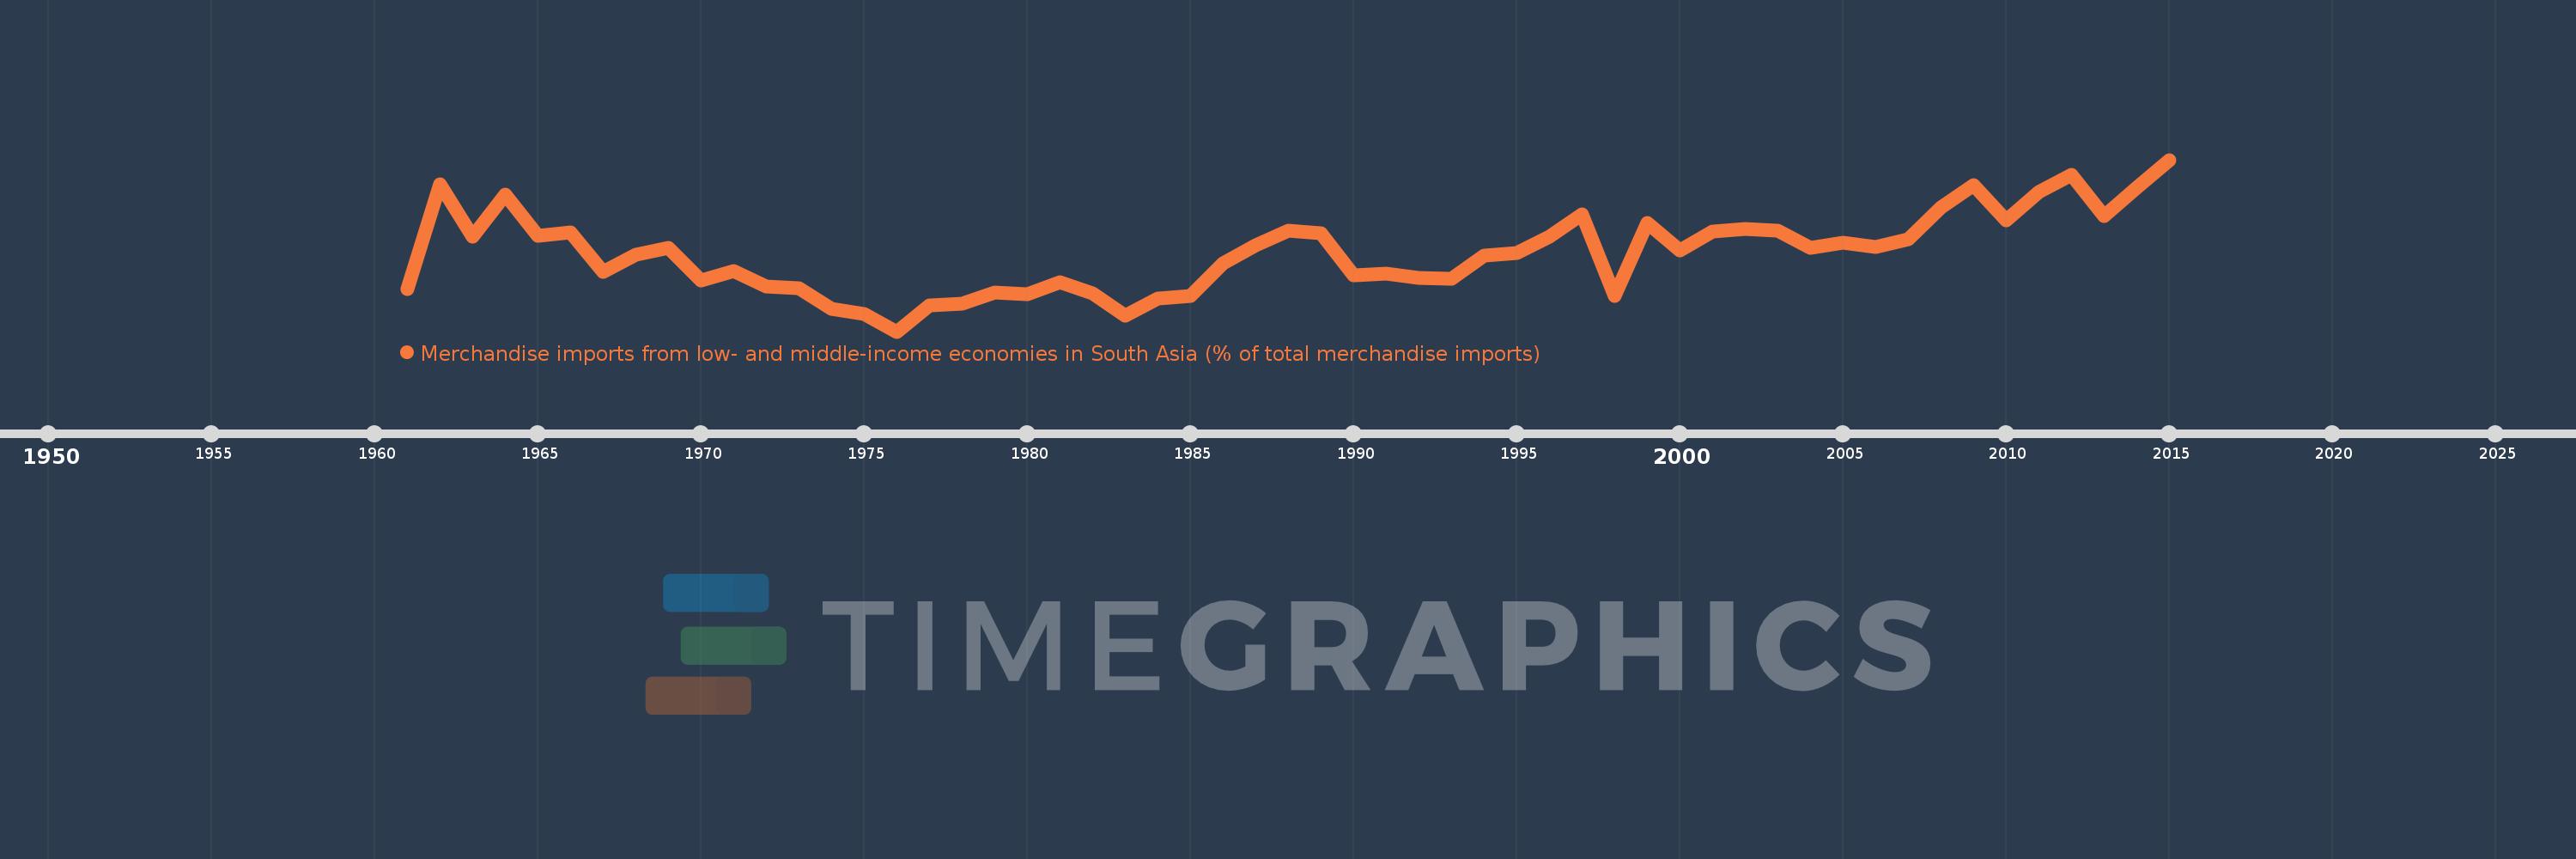
Merchandise imports from low- and middle-income economies in South Asia (% of total merchandise imports)
2015,2014,2013,2012,2011,2010,2009,2008,2007,2006,2005,2004,2003,2002,2001,2000,1999,1998,1997,1996,1995,1994,1993,1992,1991,1990,1989,1988,1987,1986,1985,1984,1983,1982,1981,1980,1979,1978,1977,1976,1975,1974,1973,1972,1971,1970,1969,1968,1967,1966,1965,1964,1963,1962,1961
Estas estadísticas en otros países:
AfghanistanAlbaniaAlgeriaAngolaAntigua and BarbudaArab WorldArgentinaArmeniaArubaAustraliaAustriaAzerbaijanBahamas, TheBahrainBangladeshBarbadosBelarusBelgiumBelizeBeninBermudaBoliviaBrazilBrunei DarussalamBulgariaBurkina FasoBurundiCabo VerdeCambodiaCameroonCanadaCaribbean small statesCentral African RepublicCentral Europe and the BalticsChadChileChinaColombiaCongo, Dem. Rep.Congo, Rep.Costa RicaCote d'IvoireCroatiaCubaCyprusCzech RepublicDenmarkDjiboutiDominicaDominican RepublicEarly-demographic dividendEast Asia & PacificEast Asia & Pacific (excluding high income)East Asia & Pacific (IDA & IBRD countries)EcuadorEgypt, Arab Rep.El SalvadorEstoniaEthiopiaEuro areaEurope & Central AsiaEurope & Central Asia (excluding high income)Europe & Central Asia (IDA & IBRD countries)European UnionFaroe IslandsFijiFinlandFragile and conflict affected situationsFranceGabonGambia, TheGeorgiaGermanyGhanaGibraltarGreeceGreenlandGrenadaGuatemalaGuineaGuyanaHaitiHeavily indebted poor countries (HIPC)High incomeHondurasHong Kong SAR, ChinaHungaryIBRD onlyIcelandIDA & IBRD totalIDA blendIDA onlyIDA totalIndiaIndonesiaIran, Islamic Rep.IraqIrelandIsraelItalyJamaicaJapanJordanKazakhstanKenyaKiribatiKorea, Dem. People’s Rep.Korea, Rep.KosovoKuwaitKyrgyz RepublicLao PDRLate-demographic dividendLatin America & Caribbean Latin America & Caribbean (excluding high income)Latin America & the Caribbean (IDA & IBRD countries)LatviaLeast developed countries: UN classificationLebanonLiberiaLibyaLithuaniaLow & middle incomeLow incomeLower middle incomeLuxembourgMacao SAR, ChinaMacedonia, FYRMadagascarMalawiMalaysiaMaldivesMaliMaltaMauritaniaMauritiusMexicoMiddle East & North AfricaMiddle East & North Africa (excluding high income)Middle East & North Africa (IDA & IBRD countries)Middle incomeMoldovaMongoliaMontenegroMoroccoMozambiqueMyanmarNauruNepalNetherlandsNew CaledoniaNew ZealandNicaraguaNigerNigeriaNorth AmericaNorwayOECD membersOmanOther small statesPacific island small statesPakistanPanamaPapua New GuineaParaguayPeruPhilippinesPolandPortugalPost-demographic dividendPre-demographic dividendQatarRomaniaRussian FederationRwandaSamoaSaudi ArabiaSenegalSerbiaSeychellesSierra LeoneSingaporeSlovak RepublicSloveniaSmall statesSolomon IslandsSomaliaSouth AfricaSouth AsiaSouth Asia (IDA & IBRD)SpainSri LankaSt. Kitts and NevisSt. LuciaSt. Vincent and the GrenadinesSub-Saharan Africa Sub-Saharan Africa (excluding high income)Sub-Saharan Africa (IDA & IBRD countries)SudanSurinameSwedenSwitzerlandSyrian Arab RepublicTajikistanTanzaniaThailandTogoTongaTrinidad and TobagoTunisiaTurkeyTurkmenistanUgandaUkraineUnited Arab EmiratesUnited KingdomUnited StatesUpper middle incomeUruguayUzbekistanVanuatuVenezuela, RBVietnamWorldYemen, Rep.ZambiaZimbabwe línea de tiempo (timeline):
En esta escala de tiempo se presenta un gráfico de 1961 y 2015 de Portugal. Los datos de 1960 están ausentes. El número de observaciones reales por fecha: 55.
Fuente (nombre):
Indicadores del desarrollo mundial
Fuente (organización):
World Bank staff estimates based data from International Monetary Fund's Direction of Trade database.
Categorías:
Private Sector, Trade
Se ha actualizado:
23 abr 2017 año
Los indicadores de los cambios de valor en los últimos años
Mínimo:
0.123
1 ene 1976 año
Máximo:
1.057
1 ene 2015 año
A la fecha de observación
Valor
Cambio absoluto
El cambio con respecto al valor anterior
1 ene 1961 año
0.352
+0.352
0.0%
1 ene 1962 año
0.925
+0.573
162.77%
1 ene 1963 año
0.64
-0.286
-30.86%
1 ene 1964 año
0.867
+0.227
35.49%
1 ene 1965 año
0.646
-0.221
-25.47%
1 ene 1966 año
0.663
+0.017
2.68%
1 ene 1967 año
0.447
-0.217
-32.69%
1 ene 1968 año
0.543
+0.096
21.58%
1 ene 1969 año
0.578
+0.035
6.54%
1 ene 1970 año
0.399
-0.18
-31.06%
1 ene 1971 año
0.451
+0.052
13.16%
1 ene 1972 año
0.37
-0.081
-18.02%
1 ene 1973 año
0.357
-0.013
-3.51%
1 ene 1974 año
0.246
-0.111
-31.04%
1 ene 1975 año
0.22
-0.026
-10.65%
1 ene 1976 año
0.123
-0.097
-43.96%
1 ene 1977 año
0.265
+0.142
115.04%
1 ene 1978 año
0.275
+0.01
3.68%
1 ene 1979 año
0.336
+0.061
22.26%
1 ene 1980 año
0.327
-0.009
-2.72%
1 ene 1981 año
0.39
+0.063
19.25%
1 ene 1982 año
0.33
-0.06
-15.38%
1 ene 1983 año
0.209
-0.121
-36.71%
1 ene 1984 año
0.304
+0.096
45.84%
1 ene 1985 año
0.315
+0.011
3.54%
1 ene 1986 año
0.495
+0.18
56.99%
1 ene 1987 año
0.594
+0.099
20.03%
1 ene 1988 año
0.67
+0.076
12.81%
1 ene 1989 año
0.656
-0.014
-2.13%
1 ene 1990 año
0.428
-0.228
-34.74%
1 ene 1991 año
0.436
+0.008
1.94%
1 ene 1992 año
0.415
-0.022
-4.97%
1 ene 1993 año
0.41
-0.004
-1.04%
1 ene 1994 año
0.537
+0.127
31.0%
1 ene 1995 año
0.552
+0.014
2.68%
1 ene 1996 año
0.641
+0.089
16.22%
1 ene 1997 año
0.761
+0.119
18.61%
1 ene 1998 año
0.316
-0.444
-58.4%
1 ene 1999 año
0.712
+0.395
124.89%
1 ene 2000 año
0.566
-0.146
-20.51%
1 ene 2001 año
0.668
+0.102
18.12%
1 ene 2002 año
0.681
+0.013
1.88%
1 ene 2003 año
0.673
-0.008
-1.16%
1 ene 2004 año
0.576
-0.097
-14.38%
1 ene 2005 año
0.605
+0.029
5.1%
1 ene 2006 año
0.584
-0.022
-3.59%
1 ene 2007 año
0.625
+0.042
7.13%
1 ene 2008 año
0.8
+0.174
27.87%
1 ene 2009 año
0.921
+0.122
15.22%
1 ene 2010 año
0.728
-0.194
-21.01%
1 ene 2011 año
0.881
+0.153
21.08%
1 ene 2012 año
0.973
+0.092
10.43%
1 ene 2013 año
0.75
-0.223
-22.92%
1 ene 2014 año
0.904
+0.154
20.48%
1 ene 2015 año
1.057
+0.153
16.96%
Ranking de los países por los datos estadísticos actuales


Comentarios: