29
/es/
es
AIzaSyAYiBZKx7MnpbEhh9jyipgxe19OcubqV5w
April 1, 2024
37560
IDA & IBRD total
IBT
false
2
1
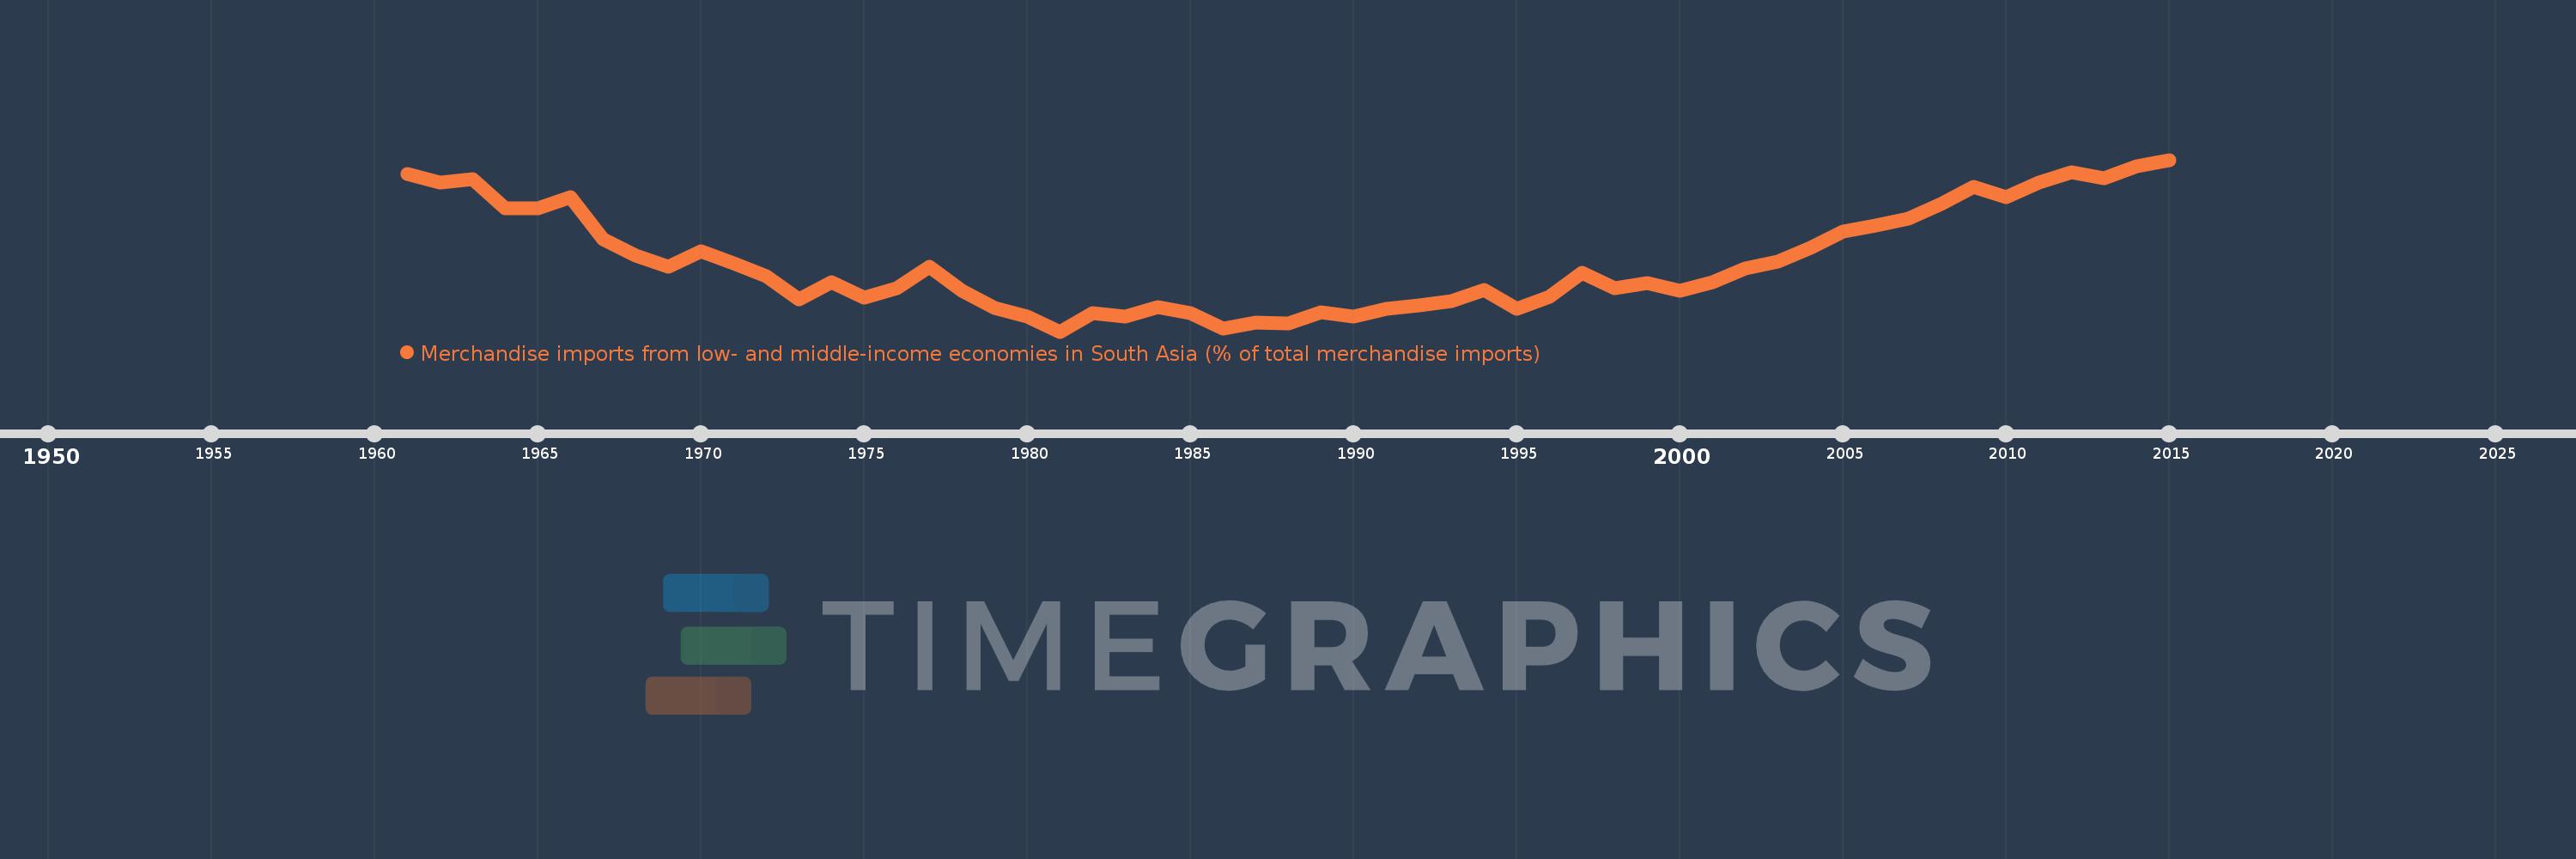
Merchandise imports from low- and middle-income economies in South Asia (% of total merchandise imports)
2015,2014,2013,2012,2011,2010,2009,2008,2007,2006,2005,2004,2003,2002,2001,2000,1999,1998,1997,1996,1995,1994,1993,1992,1991,1990,1989,1988,1987,1986,1985,1984,1983,1982,1981,1980,1979,1978,1977,1976,1975,1974,1973,1972,1971,1970,1969,1968,1967,1966,1965,1964,1963,1962,1961
Estas estadísticas en otros países:
AfghanistanAlbaniaAlgeriaAngolaAntigua and BarbudaArab WorldArgentinaArmeniaArubaAustraliaAustriaAzerbaijanBahamas, TheBahrainBangladeshBarbadosBelarusBelgiumBelizeBeninBermudaBoliviaBrazilBrunei DarussalamBulgariaBurkina FasoBurundiCabo VerdeCambodiaCameroonCanadaCaribbean small statesCentral African RepublicCentral Europe and the BalticsChadChileChinaColombiaCongo, Dem. Rep.Congo, Rep.Costa RicaCote d'IvoireCroatiaCubaCyprusCzech RepublicDenmarkDjiboutiDominicaDominican RepublicEarly-demographic dividendEast Asia & PacificEast Asia & Pacific (excluding high income)East Asia & Pacific (IDA & IBRD countries)EcuadorEgypt, Arab Rep.El SalvadorEstoniaEthiopiaEuro areaEurope & Central AsiaEurope & Central Asia (excluding high income)Europe & Central Asia (IDA & IBRD countries)European UnionFaroe IslandsFijiFinlandFragile and conflict affected situationsFranceGabonGambia, TheGeorgiaGermanyGhanaGibraltarGreeceGreenlandGrenadaGuatemalaGuineaGuyanaHaitiHeavily indebted poor countries (HIPC)High incomeHondurasHong Kong SAR, ChinaHungaryIBRD onlyIcelandIDA & IBRD totalIDA blendIDA onlyIDA totalIndiaIndonesiaIran, Islamic Rep.IraqIrelandIsraelItalyJamaicaJapanJordanKazakhstanKenyaKiribatiKorea, Dem. People’s Rep.Korea, Rep.KosovoKuwaitKyrgyz RepublicLao PDRLate-demographic dividendLatin America & Caribbean Latin America & Caribbean (excluding high income)Latin America & the Caribbean (IDA & IBRD countries)LatviaLeast developed countries: UN classificationLebanonLiberiaLibyaLithuaniaLow & middle incomeLow incomeLower middle incomeLuxembourgMacao SAR, ChinaMacedonia, FYRMadagascarMalawiMalaysiaMaldivesMaliMaltaMauritaniaMauritiusMexicoMiddle East & North AfricaMiddle East & North Africa (excluding high income)Middle East & North Africa (IDA & IBRD countries)Middle incomeMoldovaMongoliaMontenegroMoroccoMozambiqueMyanmarNauruNepalNetherlandsNew CaledoniaNew ZealandNicaraguaNigerNigeriaNorth AmericaNorwayOECD membersOmanOther small statesPacific island small statesPakistanPanamaPapua New GuineaParaguayPeruPhilippinesPolandPortugalPost-demographic dividendPre-demographic dividendQatarRomaniaRussian FederationRwandaSamoaSaudi ArabiaSenegalSerbiaSeychellesSierra LeoneSingaporeSlovak RepublicSloveniaSmall statesSolomon IslandsSomaliaSouth AfricaSouth AsiaSouth Asia (IDA & IBRD)SpainSri LankaSt. Kitts and NevisSt. LuciaSt. Vincent and the GrenadinesSub-Saharan Africa Sub-Saharan Africa (excluding high income)Sub-Saharan Africa (IDA & IBRD countries)SudanSurinameSwedenSwitzerlandSyrian Arab RepublicTajikistanTanzaniaThailandTogoTongaTrinidad and TobagoTunisiaTurkeyTurkmenistanUgandaUkraineUnited Arab EmiratesUnited KingdomUnited StatesUpper middle incomeUruguayUzbekistanVanuatuVenezuela, RBVietnamWorldYemen, Rep.ZambiaZimbabwe línea de tiempo (timeline):
En esta escala de tiempo se presenta un gráfico de 1961 y 2015 de IDA & IBRD total. Los datos de 1960 están ausentes. El número de observaciones reales por fecha: 55.
Fuente (nombre):
Indicadores del desarrollo mundial
Fuente (organización):
World Bank staff estimates based data from International Monetary Fund's Direction of Trade database.
Categorías:
Private Sector, Trade
Se ha actualizado:
23 abr 2017 año
Los indicadores de los cambios de valor en los últimos años
Mínimo:
0.754
1 ene 1981 año
Máximo:
2.174
1 ene 2015 año
A la fecha de observación
Valor
Cambio absoluto
El cambio con respecto al valor anterior
1 ene 1961 año
2.054
+2.054
0.0%
1 ene 1962 año
1.987
-0.067
-3.26%
1 ene 1963 año
2.011
+0.024
1.19%
1 ene 1964 año
1.776
-0.235
-11.69%
1 ene 1965 año
1.773
-0.003
-0.16%
1 ene 1966 año
1.865
+0.093
5.23%
1 ene 1967 año
1.519
-0.347
-18.59%
1 ene 1968 año
1.384
-0.135
-8.89%
1 ene 1969 año
1.291
-0.093
-6.71%
1 ene 1970 año
1.42
+0.129
10.0%
1 ene 1971 año
1.319
-0.101
-7.09%
1 ene 1972 año
1.214
-0.105
-7.96%
1 ene 1973 año
1.022
-0.192
-15.83%
1 ene 1974 año
1.164
+0.143
13.94%
1 ene 1975 año
1.031
-0.134
-11.47%
1 ene 1976 año
1.112
+0.081
7.83%
1 ene 1977 año
1.291
+0.179
16.1%
1 ene 1978 año
1.09
-0.2
-15.52%
1 ene 1979 año
0.95
-0.14
-12.86%
1 ene 1980 año
0.876
-0.074
-7.79%
1 ene 1981 año
0.754
-0.122
-13.9%
1 ene 1982 año
0.908
+0.154
20.43%
1 ene 1983 año
0.875
-0.034
-3.71%
1 ene 1984 año
0.953
+0.078
8.9%
1 ene 1985 año
0.906
-0.047
-4.9%
1 ene 1986 año
0.779
-0.127
-13.98%
1 ene 1987 año
0.831
+0.052
6.64%
1 ene 1988 año
0.821
-0.01
-1.22%
1 ene 1989 año
0.915
+0.095
11.51%
1 ene 1990 año
0.878
-0.038
-4.11%
1 ene 1991 año
0.943
+0.065
7.42%
1 ene 1992 año
0.974
+0.031
3.32%
1 ene 1993 año
1.005
+0.03
3.13%
1 ene 1994 año
1.099
+0.094
9.37%
1 ene 1995 año
0.945
-0.154
-14.03%
1 ene 1996 año
1.044
+0.1
10.54%
1 ene 1997 año
1.239
+0.195
18.63%
1 ene 1998 año
1.11
-0.129
-10.4%
1 ene 1999 año
1.157
+0.047
4.24%
1 ene 2000 año
1.091
-0.066
-5.71%
1 ene 2001 año
1.159
+0.068
6.22%
1 ene 2002 año
1.277
+0.118
10.16%
1 ene 2003 año
1.335
+0.058
4.57%
1 ene 2004 año
1.443
+0.108
8.1%
1 ene 2005 año
1.579
+0.136
9.44%
1 ene 2006 año
1.629
+0.05
3.16%
1 ene 2007 año
1.69
+0.061
3.73%
1 ene 2008 año
1.81
+0.12
7.1%
1 ene 2009 año
1.951
+0.141
7.79%
1 ene 2010 año
1.863
-0.088
-4.53%
1 ene 2011 año
1.989
+0.126
6.79%
1 ene 2012 año
2.073
+0.084
4.23%
1 ene 2013 año
2.021
-0.052
-2.52%
1 ene 2014 año
2.12
+0.099
4.91%
1 ene 2015 año
2.174
+0.054
2.54%
Ranking de los países por los datos estadísticos actuales


Comentarios: