29
/es/
es
AIzaSyAYiBZKx7MnpbEhh9jyipgxe19OcubqV5w
April 1, 2024
172315
Kuwait
KWT
true
2
1
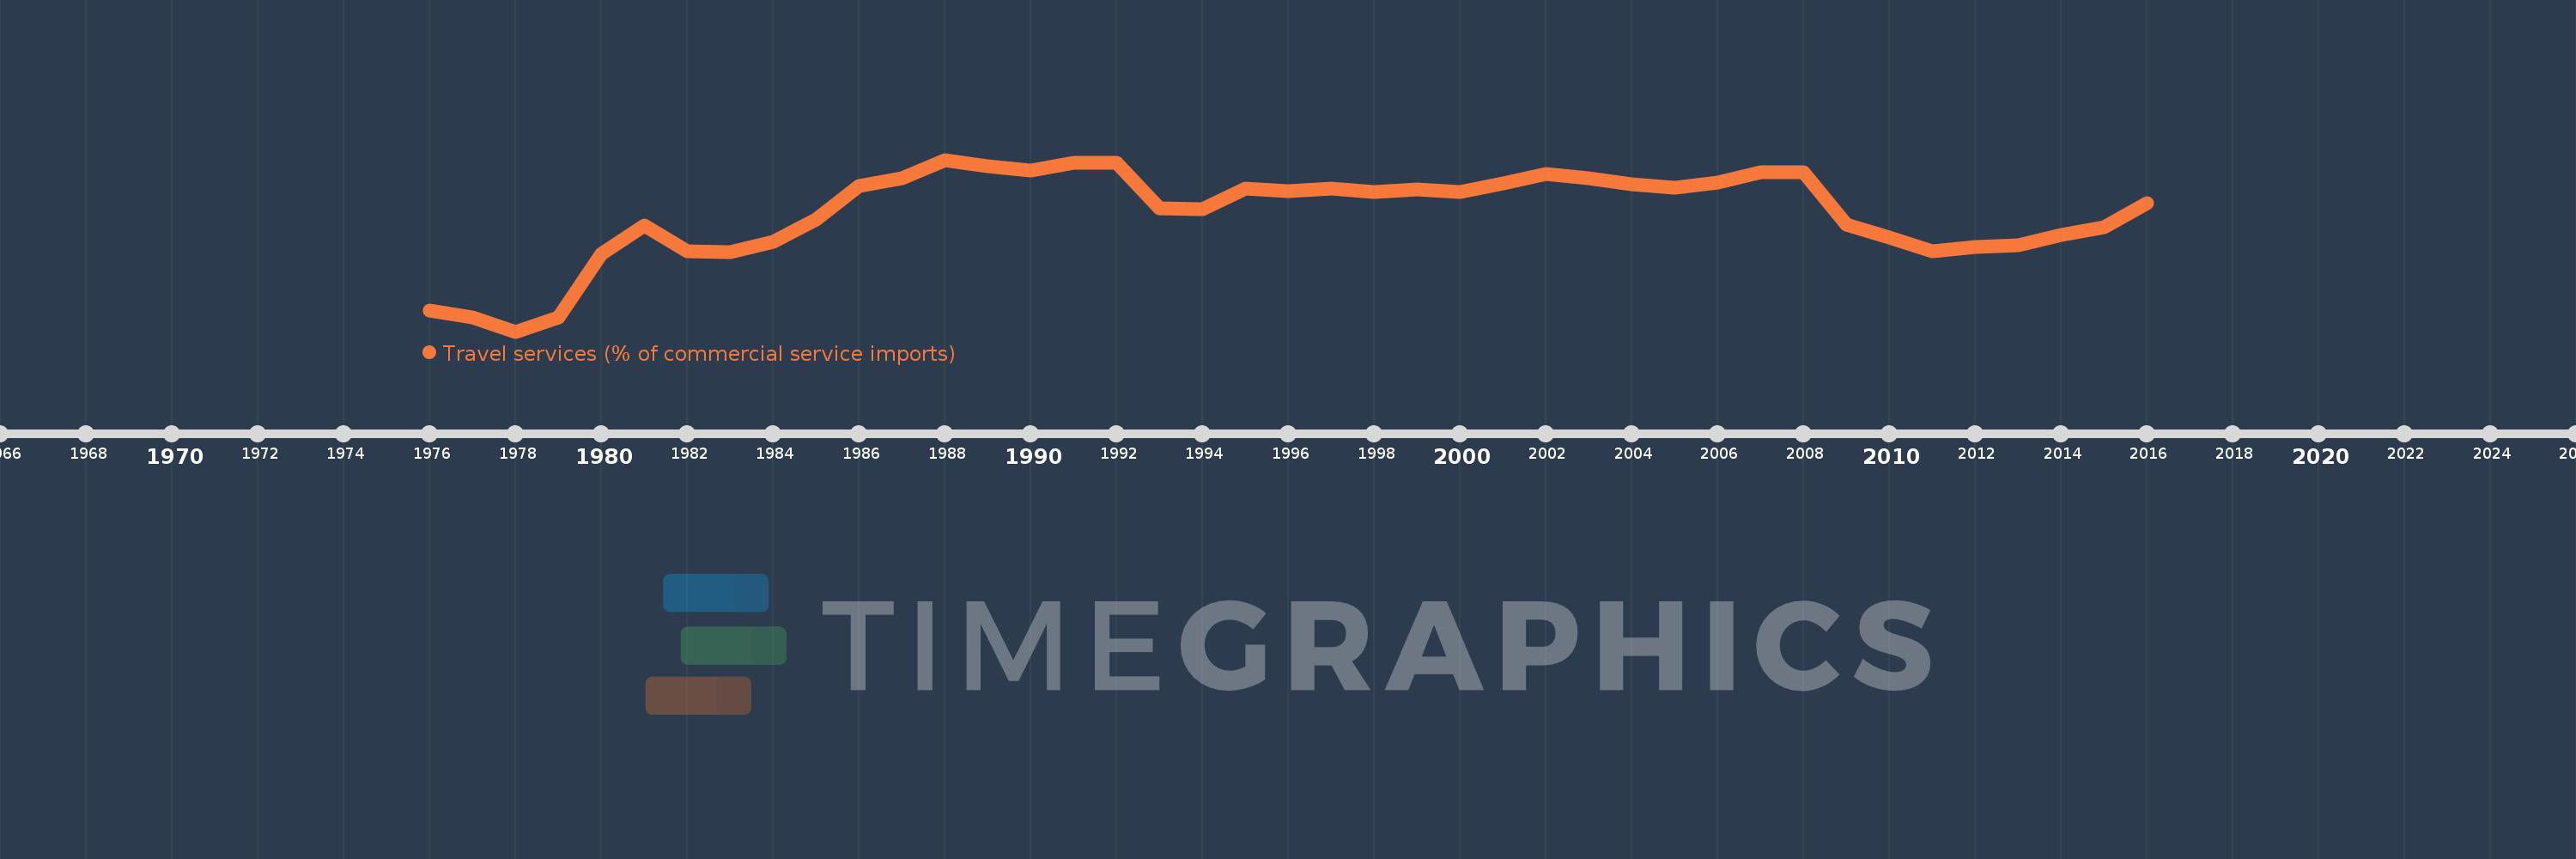
Travel services (% of commercial service imports)
2016,2015,2014,2013,2012,2011,2010,2009,2008,2007,2006,2005,2004,2003,2002,2001,2000,1999,1998,1997,1996,1995,1994,1993,1992,1991,1990,1989,1988,1987,1986,1985,1984,1983,1982,1981,1980,1979,1978,1977,1976
Estas estadísticas en otros países:
AfghanistanAlbaniaAlgeriaAngolaAntigua and BarbudaArab WorldArgentinaArmeniaArubaAustraliaAustriaAzerbaijanBahamas, TheBahrainBangladeshBarbadosBelarusBelgiumBelizeBeninBermudaBhutanBoliviaBosnia and HerzegovinaBotswanaBrazilBrunei DarussalamBulgariaBurkina FasoBurundiCabo VerdeCambodiaCameroonCanadaCaribbean small statesCentral African RepublicCentral Europe and the BalticsChadChileChinaColombiaComorosCongo, Dem. Rep.Congo, Rep.Costa RicaCote d'IvoireCroatiaCuracaoCyprusCzech RepublicDenmarkDjiboutiDominicaDominican RepublicEarly-demographic dividendEast Asia & PacificEast Asia & Pacific (excluding high income)East Asia & Pacific (IDA & IBRD countries)EcuadorEgypt, Arab Rep.El SalvadorEritreaEstoniaEthiopiaEuro areaEurope & Central AsiaEurope & Central Asia (excluding high income)Europe & Central Asia (IDA & IBRD countries)European UnionFaroe IslandsFijiFinlandFragile and conflict affected situationsFranceFrench PolynesiaGabonGambia, TheGeorgiaGermanyGhanaGreeceGrenadaGuatemalaGuineaGuinea-BissauGuyanaHaitiHeavily indebted poor countries (HIPC)High incomeHondurasHong Kong SAR, ChinaHungaryIBRD onlyIcelandIDA & IBRD totalIDA onlyIDA totalIndiaIndonesiaIran, Islamic Rep.IraqIrelandIsraelItalyJamaicaJapanJordanKazakhstanKenyaKiribatiKorea, Rep.KosovoKuwaitKyrgyz RepublicLao PDRLate-demographic dividendLatin America & Caribbean Latin America & Caribbean (excluding high income)Latin America & the Caribbean (IDA & IBRD countries)LatviaLeast developed countries: UN classificationLebanonLesothoLiberiaLibyaLithuaniaLow & middle incomeLow incomeLower middle incomeLuxembourgMacao SAR, ChinaMacedonia, FYRMadagascarMalawiMalaysiaMaldivesMaliMaltaMarshall IslandsMauritaniaMauritiusMexicoMicronesia, Fed. Sts.Middle East & North AfricaMiddle East & North Africa (excluding high income)Middle East & North Africa (IDA & IBRD countries)Middle incomeMoldovaMongoliaMontenegroMoroccoMozambiqueMyanmarNamibiaNepalNetherlandsNew CaledoniaNew ZealandNicaraguaNigerNigeriaNorth AmericaNorwayOECD membersOmanOther small statesPacific island small statesPakistanPalauPanamaPapua New GuineaParaguayPeruPhilippinesPolandPortugalPost-demographic dividendPre-demographic dividendQatarRomaniaRussian FederationRwandaSamoaSao Tome and PrincipeSaudi ArabiaSenegalSerbiaSeychellesSierra LeoneSingaporeSint Maarten (Dutch part)Slovak RepublicSloveniaSmall statesSolomon IslandsSouth AfricaSouth AsiaSouth Asia (IDA & IBRD)South SudanSpainSri LankaSt. Kitts and NevisSt. LuciaSt. Vincent and the GrenadinesSub-Saharan Africa Sub-Saharan Africa (excluding high income)Sub-Saharan Africa (IDA & IBRD countries)SudanSurinameSwazilandSwedenSwitzerlandSyrian Arab RepublicTajikistanTanzaniaThailandTimor-LesteTogoTongaTrinidad and TobagoTunisiaTurkeyTuvaluUgandaUkraineUnited KingdomUnited StatesUpper middle incomeUruguayVanuatuVenezuela, RBWest Bank and GazaWorldYemen, Rep.ZambiaZimbabwe línea de tiempo (timeline):
En esta escala de tiempo se presenta un gráfico de 1976 y 2016 de Kuwait. Los datos de 1975 están ausentes. El número de observaciones reales por fecha: 41.
Fuente (nombre):
Indicadores del desarrollo mundial
Fuente (organización):
International Monetary Fund, Balance of Payments Statistics Yearbook and data files.
Categorías:
Private Sector, Trade
Se ha actualizado:
23 abr 2017 año
Los indicadores de los cambios de valor en los últimos años
Mínimo:
26.19
1 ene 1978 año
Máximo:
66.141
1 ene 1988 año
A la fecha de observación
Valor
Cambio absoluto
El cambio con respecto al valor anterior
1 ene 1976 año
31.053
+31.053
0.0%
1 ene 1977 año
29.555
-1.498
-4.82%
1 ene 1978 año
26.19
-3.364
-11.38%
1 ene 1979 año
29.444
+3.254
12.42%
1 ene 1980 año
44.186
+14.742
50.07%
1 ene 1981 año
50.843
+6.657
15.07%
1 ene 1982 año
44.802
-6.04
-11.88%
1 ene 1983 año
44.59
-0.213
-0.47%
1 ene 1984 año
47.038
+2.448
5.49%
1 ene 1985 año
52.294
+5.256
11.17%
1 ene 1986 año
59.98
+7.686
14.7%
1 ene 1987 año
61.774
+1.794
2.99%
1 ene 1988 año
66.141
+4.367
7.07%
1 ene 1989 año
64.637
-1.504
-2.27%
1 ene 1990 año
63.742
-0.895
-1.38%
1 ene 1991 año
65.513
+1.771
2.78%
1 ene 1992 año
65.446
-0.067
-0.1%
1 ene 1993 año
54.896
-10.55
-16.12%
1 ene 1994 año
54.736
-0.16
-0.29%
1 ene 1995 año
59.422
+4.686
8.56%
1 ene 1996 año
58.767
-0.655
-1.1%
1 ene 1997 año
59.504
+0.737
1.25%
1 ene 1998 año
58.618
-0.886
-1.49%
1 ene 1999 año
59.264
+0.647
1.1%
1 ene 2000 año
58.694
-0.571
-0.96%
1 ene 2001 año
60.632
+1.939
3.3%
1 ene 2002 año
62.884
+2.252
3.71%
1 ene 2003 año
61.892
-0.993
-1.58%
1 ene 2004 año
60.496
-1.396
-2.25%
1 ene 2005 año
59.685
-0.811
-1.34%
1 ene 2006 año
60.883
+1.199
2.01%
1 ene 2007 año
63.289
+2.406
3.95%
1 ene 2008 año
63.237
-0.052
-0.08%
1 ene 2009 año
51.154
-12.083
-19.11%
1 ene 2010 año
48.027
-3.127
-6.11%
1 ene 2011 año
44.919
-3.108
-6.47%
1 ene 2012 año
45.86
+0.941
2.09%
1 ene 2013 año
46.213
+0.353
0.77%
1 ene 2014 año
48.572
+2.359
5.1%
1 ene 2015 año
50.444
+1.872
3.85%
1 ene 2016 año
56.069
+5.626
11.15%
Ranking de los países por los datos estadísticos actuales


Comentarios: