29
/es/
es
AIzaSyAYiBZKx7MnpbEhh9jyipgxe19OcubqV5w
April 1, 2024
59439
Sub-Saharan Africa
SSF
false
2
1
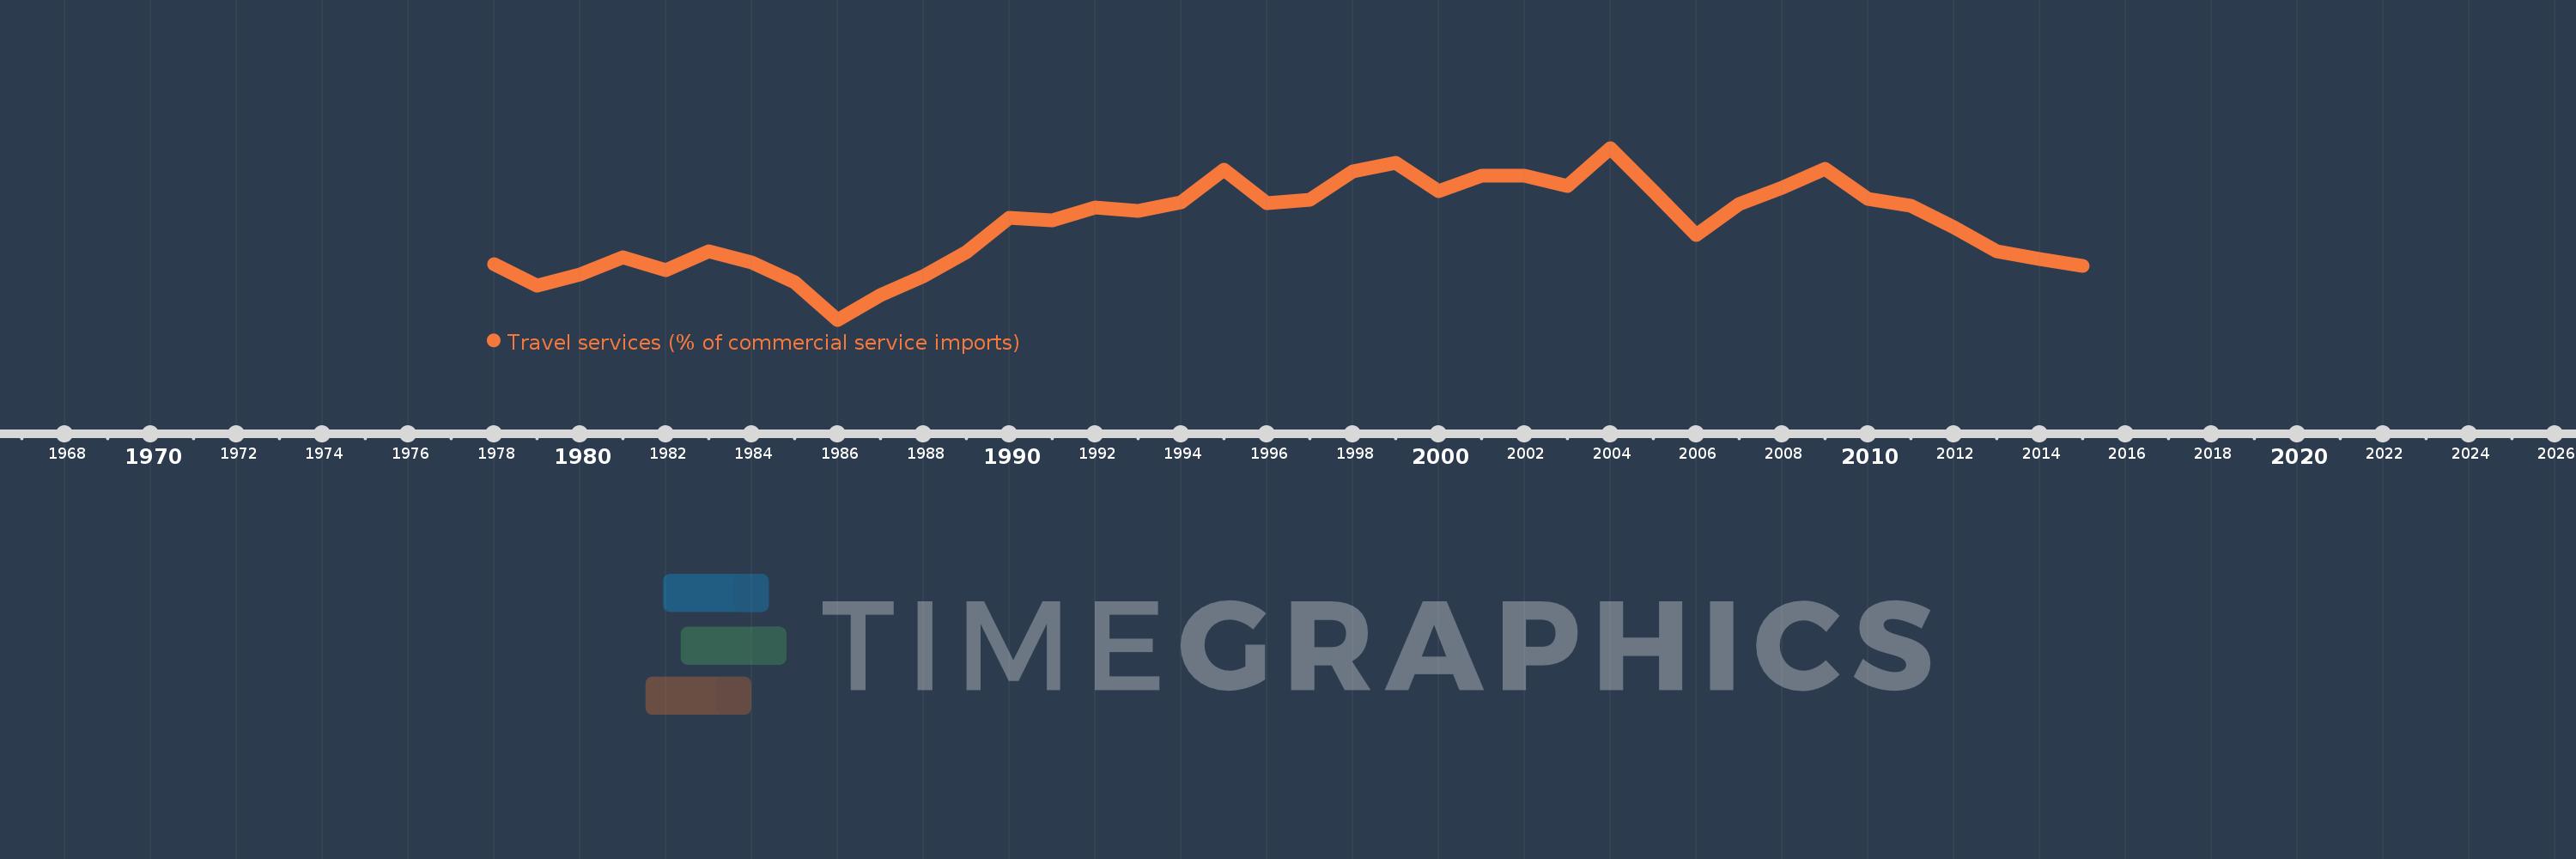
Travel services (% of commercial service imports)
2015,2014,2013,2012,2011,2010,2009,2008,2007,2006,2005,2004,2003,2002,2001,2000,1999,1998,1997,1996,1995,1994,1993,1992,1991,1990,1989,1988,1987,1986,1985,1984,1983,1982,1981,1980,1979,1978
Estas estadísticas en otros países:
AfghanistanAlbaniaAlgeriaAngolaAntigua and BarbudaArab WorldArgentinaArmeniaArubaAustraliaAustriaAzerbaijanBahamas, TheBahrainBangladeshBarbadosBelarusBelgiumBelizeBeninBermudaBhutanBoliviaBosnia and HerzegovinaBotswanaBrazilBrunei DarussalamBulgariaBurkina FasoBurundiCabo VerdeCambodiaCameroonCanadaCaribbean small statesCentral African RepublicCentral Europe and the BalticsChadChileChinaColombiaComorosCongo, Dem. Rep.Congo, Rep.Costa RicaCote d'IvoireCroatiaCuracaoCyprusCzech RepublicDenmarkDjiboutiDominicaDominican RepublicEarly-demographic dividendEast Asia & PacificEast Asia & Pacific (excluding high income)East Asia & Pacific (IDA & IBRD countries)EcuadorEgypt, Arab Rep.El SalvadorEritreaEstoniaEthiopiaEuro areaEurope & Central AsiaEurope & Central Asia (excluding high income)Europe & Central Asia (IDA & IBRD countries)European UnionFaroe IslandsFijiFinlandFragile and conflict affected situationsFranceFrench PolynesiaGabonGambia, TheGeorgiaGermanyGhanaGreeceGrenadaGuatemalaGuineaGuinea-BissauGuyanaHaitiHeavily indebted poor countries (HIPC)High incomeHondurasHong Kong SAR, ChinaHungaryIBRD onlyIcelandIDA & IBRD totalIDA onlyIDA totalIndiaIndonesiaIran, Islamic Rep.IraqIrelandIsraelItalyJamaicaJapanJordanKazakhstanKenyaKiribatiKorea, Rep.KosovoKuwaitKyrgyz RepublicLao PDRLate-demographic dividendLatin America & Caribbean Latin America & Caribbean (excluding high income)Latin America & the Caribbean (IDA & IBRD countries)LatviaLeast developed countries: UN classificationLebanonLesothoLiberiaLibyaLithuaniaLow & middle incomeLow incomeLower middle incomeLuxembourgMacao SAR, ChinaMacedonia, FYRMadagascarMalawiMalaysiaMaldivesMaliMaltaMarshall IslandsMauritaniaMauritiusMexicoMicronesia, Fed. Sts.Middle East & North AfricaMiddle East & North Africa (excluding high income)Middle East & North Africa (IDA & IBRD countries)Middle incomeMoldovaMongoliaMontenegroMoroccoMozambiqueMyanmarNamibiaNepalNetherlandsNew CaledoniaNew ZealandNicaraguaNigerNigeriaNorth AmericaNorwayOECD membersOmanOther small statesPacific island small statesPakistanPalauPanamaPapua New GuineaParaguayPeruPhilippinesPolandPortugalPost-demographic dividendPre-demographic dividendQatarRomaniaRussian FederationRwandaSamoaSao Tome and PrincipeSaudi ArabiaSenegalSerbiaSeychellesSierra LeoneSingaporeSint Maarten (Dutch part)Slovak RepublicSloveniaSmall statesSolomon IslandsSouth AfricaSouth AsiaSouth Asia (IDA & IBRD)South SudanSpainSri LankaSt. Kitts and NevisSt. LuciaSt. Vincent and the GrenadinesSub-Saharan Africa Sub-Saharan Africa (excluding high income)Sub-Saharan Africa (IDA & IBRD countries)SudanSurinameSwazilandSwedenSwitzerlandSyrian Arab RepublicTajikistanTanzaniaThailandTimor-LesteTogoTongaTrinidad and TobagoTunisiaTurkeyTuvaluUgandaUkraineUnited KingdomUnited StatesUpper middle incomeUruguayVanuatuVenezuela, RBWest Bank and GazaWorldYemen, Rep.ZambiaZimbabwe línea de tiempo (timeline):
En esta escala de tiempo se presenta un gráfico de 1978 y 2015 de Sub-Saharan Africa . Los datos de 1977 están ausentes. El número de observaciones reales por fecha: 38.
Fuente (nombre):
Indicadores del desarrollo mundial
Fuente (organización):
International Monetary Fund, Balance of Payments Statistics Yearbook and data files.
Categorías:
Private Sector, Trade
Se ha actualizado:
23 abr 2017 año
Los indicadores de los cambios de valor en los últimos años
Mínimo:
14.332
1 ene 1986 año
Máximo:
27.768
1 ene 2004 año
A la fecha de observación
Valor
Cambio absoluto
El cambio con respecto al valor anterior
1 ene 1978 año
18.656
+18.656
0.0%
1 ene 1979 año
16.984
-1.672
-8.96%
1 ene 1980 año
17.845
+0.862
5.07%
1 ene 1981 año
19.207
+1.362
7.63%
1 ene 1982 año
18.178
-1.029
-5.36%
1 ene 1983 año
19.682
+1.505
8.28%
1 ene 1984 año
18.831
-0.851
-4.33%
1 ene 1985 año
17.301
-1.53
-8.12%
1 ene 1986 año
14.332
-2.969
-17.16%
1 ene 1987 año
16.266
+1.934
13.49%
1 ene 1988 año
17.707
+1.441
8.86%
1 ene 1989 año
19.63
+1.923
10.86%
1 ene 1990 año
22.327
+2.697
13.74%
1 ene 1991 año
22.115
-0.212
-0.95%
1 ene 1992 año
23.142
+1.027
4.64%
1 ene 1993 año
22.857
-0.285
-1.23%
1 ene 1994 año
23.537
+0.68
2.97%
1 ene 1995 año
26.095
+2.558
10.87%
1 ene 1996 año
23.456
-2.64
-10.12%
1 ene 1997 año
23.702
+0.247
1.05%
1 ene 1998 año
25.908
+2.206
9.31%
1 ene 1999 año
26.615
+0.707
2.73%
1 ene 2000 año
24.391
-2.225
-8.36%
1 ene 2001 año
25.587
+1.196
4.91%
1 ene 2002 año
25.628
+0.041
0.16%
1 ene 2003 año
24.773
-0.855
-3.34%
1 ene 2004 año
27.768
+2.995
12.09%
1 ene 2005 año
24.411
-3.358
-12.09%
1 ene 2006 año
20.977
-3.434
-14.07%
1 ene 2007 año
23.377
+2.4
11.44%
1 ene 2008 año
24.66
+1.283
5.49%
1 ene 2009 año
26.169
+1.509
6.12%
1 ene 2010 año
23.755
-2.414
-9.23%
1 ene 2011 año
23.264
-0.491
-2.07%
1 ene 2012 año
21.594
-1.67
-7.18%
1 ene 2013 año
19.66
-1.933
-8.95%
1 ene 2014 año
19.083
-0.577
-2.93%
1 ene 2015 año
18.558
-0.526
-2.75%
Ranking de los países por los datos estadísticos actuales


Comentarios: