29
/es/
es
AIzaSyAYiBZKx7MnpbEhh9jyipgxe19OcubqV5w
April 1, 2024
165659
Jordan
JOR
true
2
1
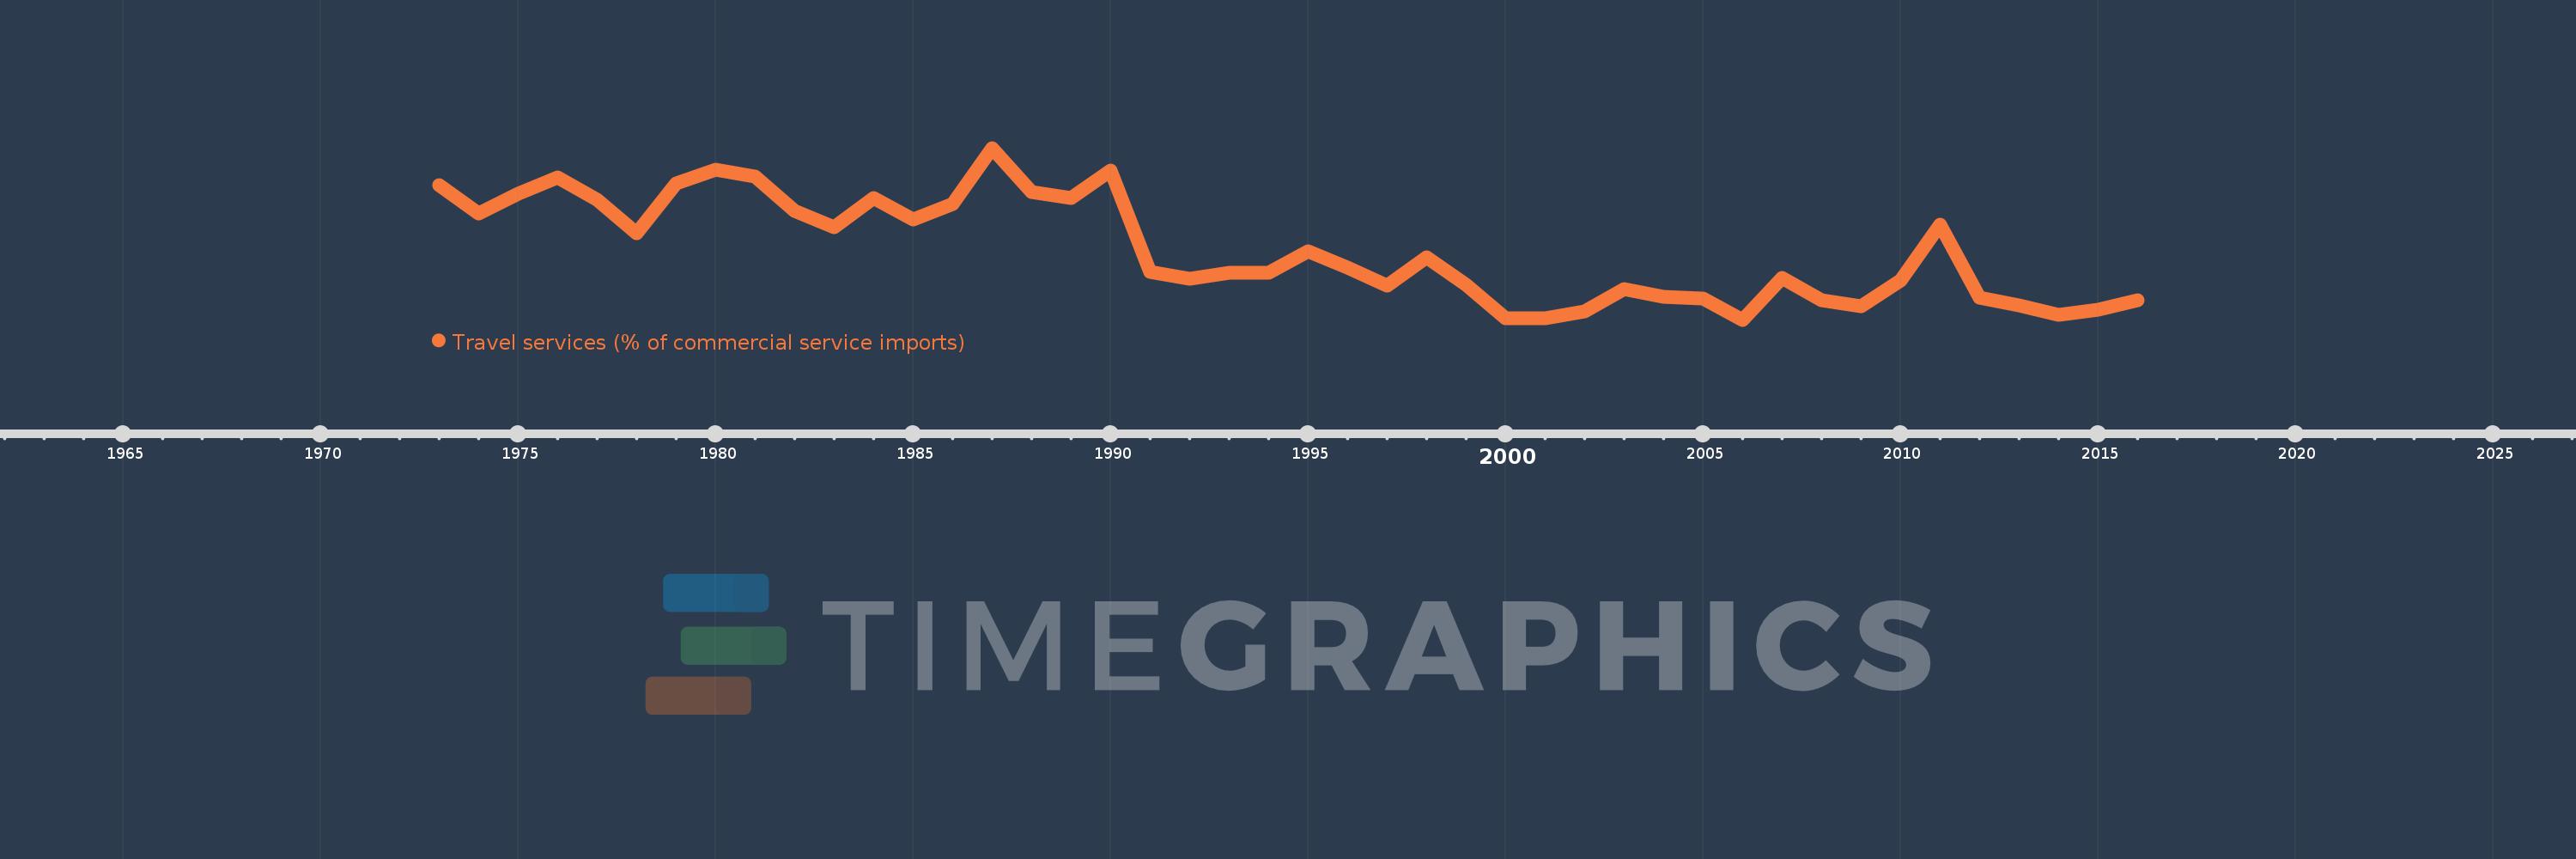
Travel services (% of commercial service imports)
2016,2015,2014,2013,2012,2011,2010,2009,2008,2007,2006,2005,2004,2003,2002,2001,2000,1999,1998,1997,1996,1995,1994,1993,1992,1991,1990,1989,1988,1987,1986,1985,1984,1983,1982,1981,1980,1979,1978,1977,1976,1975,1974,1973
Estas estadísticas en otros países:
AfghanistanAlbaniaAlgeriaAngolaAntigua and BarbudaArab WorldArgentinaArmeniaArubaAustraliaAustriaAzerbaijanBahamas, TheBahrainBangladeshBarbadosBelarusBelgiumBelizeBeninBermudaBhutanBoliviaBosnia and HerzegovinaBotswanaBrazilBrunei DarussalamBulgariaBurkina FasoBurundiCabo VerdeCambodiaCameroonCanadaCaribbean small statesCentral African RepublicCentral Europe and the BalticsChadChileChinaColombiaComorosCongo, Dem. Rep.Congo, Rep.Costa RicaCote d'IvoireCroatiaCuracaoCyprusCzech RepublicDenmarkDjiboutiDominicaDominican RepublicEarly-demographic dividendEast Asia & PacificEast Asia & Pacific (excluding high income)East Asia & Pacific (IDA & IBRD countries)EcuadorEgypt, Arab Rep.El SalvadorEritreaEstoniaEthiopiaEuro areaEurope & Central AsiaEurope & Central Asia (excluding high income)Europe & Central Asia (IDA & IBRD countries)European UnionFaroe IslandsFijiFinlandFragile and conflict affected situationsFranceFrench PolynesiaGabonGambia, TheGeorgiaGermanyGhanaGreeceGrenadaGuatemalaGuineaGuinea-BissauGuyanaHaitiHeavily indebted poor countries (HIPC)High incomeHondurasHong Kong SAR, ChinaHungaryIBRD onlyIcelandIDA & IBRD totalIDA onlyIDA totalIndiaIndonesiaIran, Islamic Rep.IraqIrelandIsraelItalyJamaicaJapanJordanKazakhstanKenyaKiribatiKorea, Rep.KosovoKuwaitKyrgyz RepublicLao PDRLate-demographic dividendLatin America & Caribbean Latin America & Caribbean (excluding high income)Latin America & the Caribbean (IDA & IBRD countries)LatviaLeast developed countries: UN classificationLebanonLesothoLiberiaLibyaLithuaniaLow & middle incomeLow incomeLower middle incomeLuxembourgMacao SAR, ChinaMacedonia, FYRMadagascarMalawiMalaysiaMaldivesMaliMaltaMarshall IslandsMauritaniaMauritiusMexicoMicronesia, Fed. Sts.Middle East & North AfricaMiddle East & North Africa (excluding high income)Middle East & North Africa (IDA & IBRD countries)Middle incomeMoldovaMongoliaMontenegroMoroccoMozambiqueMyanmarNamibiaNepalNetherlandsNew CaledoniaNew ZealandNicaraguaNigerNigeriaNorth AmericaNorwayOECD membersOmanOther small statesPacific island small statesPakistanPalauPanamaPapua New GuineaParaguayPeruPhilippinesPolandPortugalPost-demographic dividendPre-demographic dividendQatarRomaniaRussian FederationRwandaSamoaSao Tome and PrincipeSaudi ArabiaSenegalSerbiaSeychellesSierra LeoneSingaporeSint Maarten (Dutch part)Slovak RepublicSloveniaSmall statesSolomon IslandsSouth AfricaSouth AsiaSouth Asia (IDA & IBRD)South SudanSpainSri LankaSt. Kitts and NevisSt. LuciaSt. Vincent and the GrenadinesSub-Saharan Africa Sub-Saharan Africa (excluding high income)Sub-Saharan Africa (IDA & IBRD countries)SudanSurinameSwazilandSwedenSwitzerlandSyrian Arab RepublicTajikistanTanzaniaThailandTimor-LesteTogoTongaTrinidad and TobagoTunisiaTurkeyTuvaluUgandaUkraineUnited KingdomUnited StatesUpper middle incomeUruguayVanuatuVenezuela, RBWest Bank and GazaWorldYemen, Rep.ZambiaZimbabwe línea de tiempo (timeline):
En esta escala de tiempo se presenta un gráfico de 1973 y 2016 de Jordan. Los datos de 1972 están ausentes. El número de observaciones reales por fecha: 44.
Fuente (nombre):
Indicadores del desarrollo mundial
Fuente (organización):
International Monetary Fund, Balance of Payments Statistics Yearbook and data files.
Categorías:
Private Sector, Trade
Se ha actualizado:
23 abr 2017 año
Los indicadores de los cambios de valor en los últimos años
Mínimo:
23.741
1 ene 2006 año
Máximo:
46.669
1 ene 1987 año
A la fecha de observación
Valor
Cambio absoluto
El cambio con respecto al valor anterior
1 ene 1973 año
41.697
+41.697
0.0%
1 ene 1974 año
37.919
-3.778
-9.06%
1 ene 1975 año
40.559
+2.64
6.96%
1 ene 1976 año
42.731
+2.171
5.35%
1 ene 1977 año
39.703
-3.028
-7.09%
1 ene 1978 año
35.333
-4.37
-11.01%
1 ene 1979 año
41.957
+6.625
18.75%
1 ene 1980 año
43.813
+1.856
4.42%
1 ene 1981 año
42.902
-0.912
-2.08%
1 ene 1982 año
38.32
-4.582
-10.68%
1 ene 1983 año
36.096
-2.224
-5.8%
1 ene 1984 año
40.042
+3.946
10.93%
1 ene 1985 año
37.149
-2.893
-7.23%
1 ene 1986 año
39.14
+1.991
5.36%
1 ene 1987 año
46.669
+7.53
19.24%
1 ene 1988 año
40.82
-5.85
-12.53%
1 ene 1989 año
40.02
-0.799
-1.96%
1 ene 1990 año
43.659
+3.639
9.09%
1 ene 1991 año
30.083
-13.576
-31.1%
1 ene 1992 año
29.21
-0.872
-2.9%
1 ene 1993 año
30.012
+0.802
2.74%
1 ene 1994 año
30.044
+0.032
0.11%
1 ene 1995 año
32.935
+2.891
9.62%
1 ene 1996 año
30.667
-2.268
-6.89%
1 ene 1997 año
28.29
-2.377
-7.75%
1 ene 1998 año
32.065
+3.774
13.34%
1 ene 1999 año
28.399
-3.666
-11.43%
1 ene 2000 año
23.92
-4.479
-15.77%
1 ene 2001 año
23.903
-0.017
-0.07%
1 ene 2002 año
24.835
+0.932
3.9%
1 ene 2003 año
27.847
+3.012
12.13%
1 ene 2004 año
26.745
-1.103
-3.96%
1 ene 2005 año
26.559
-0.186
-0.69%
1 ene 2006 año
23.741
-2.818
-10.61%
1 ene 2007 año
29.325
+5.584
23.52%
1 ene 2008 año
26.3
-3.026
-10.32%
1 ene 2009 año
25.562
-0.738
-2.81%
1 ene 2010 año
28.973
+3.411
13.34%
1 ene 2011 año
36.445
+7.472
25.79%
1 ene 2012 año
26.638
-9.807
-26.91%
1 ene 2013 año
25.61
-1.028
-3.86%
1 ene 2014 año
24.365
-1.245
-4.86%
1 ene 2015 año
25.08
+0.715
2.94%
1 ene 2016 año
26.307
+1.226
4.89%
Ranking de los países por los datos estadísticos actuales


Comentarios: