29
/es/
es
AIzaSyAYiBZKx7MnpbEhh9jyipgxe19OcubqV5w
April 1, 2024
79073
Bangladesh
BGD
true
2
1
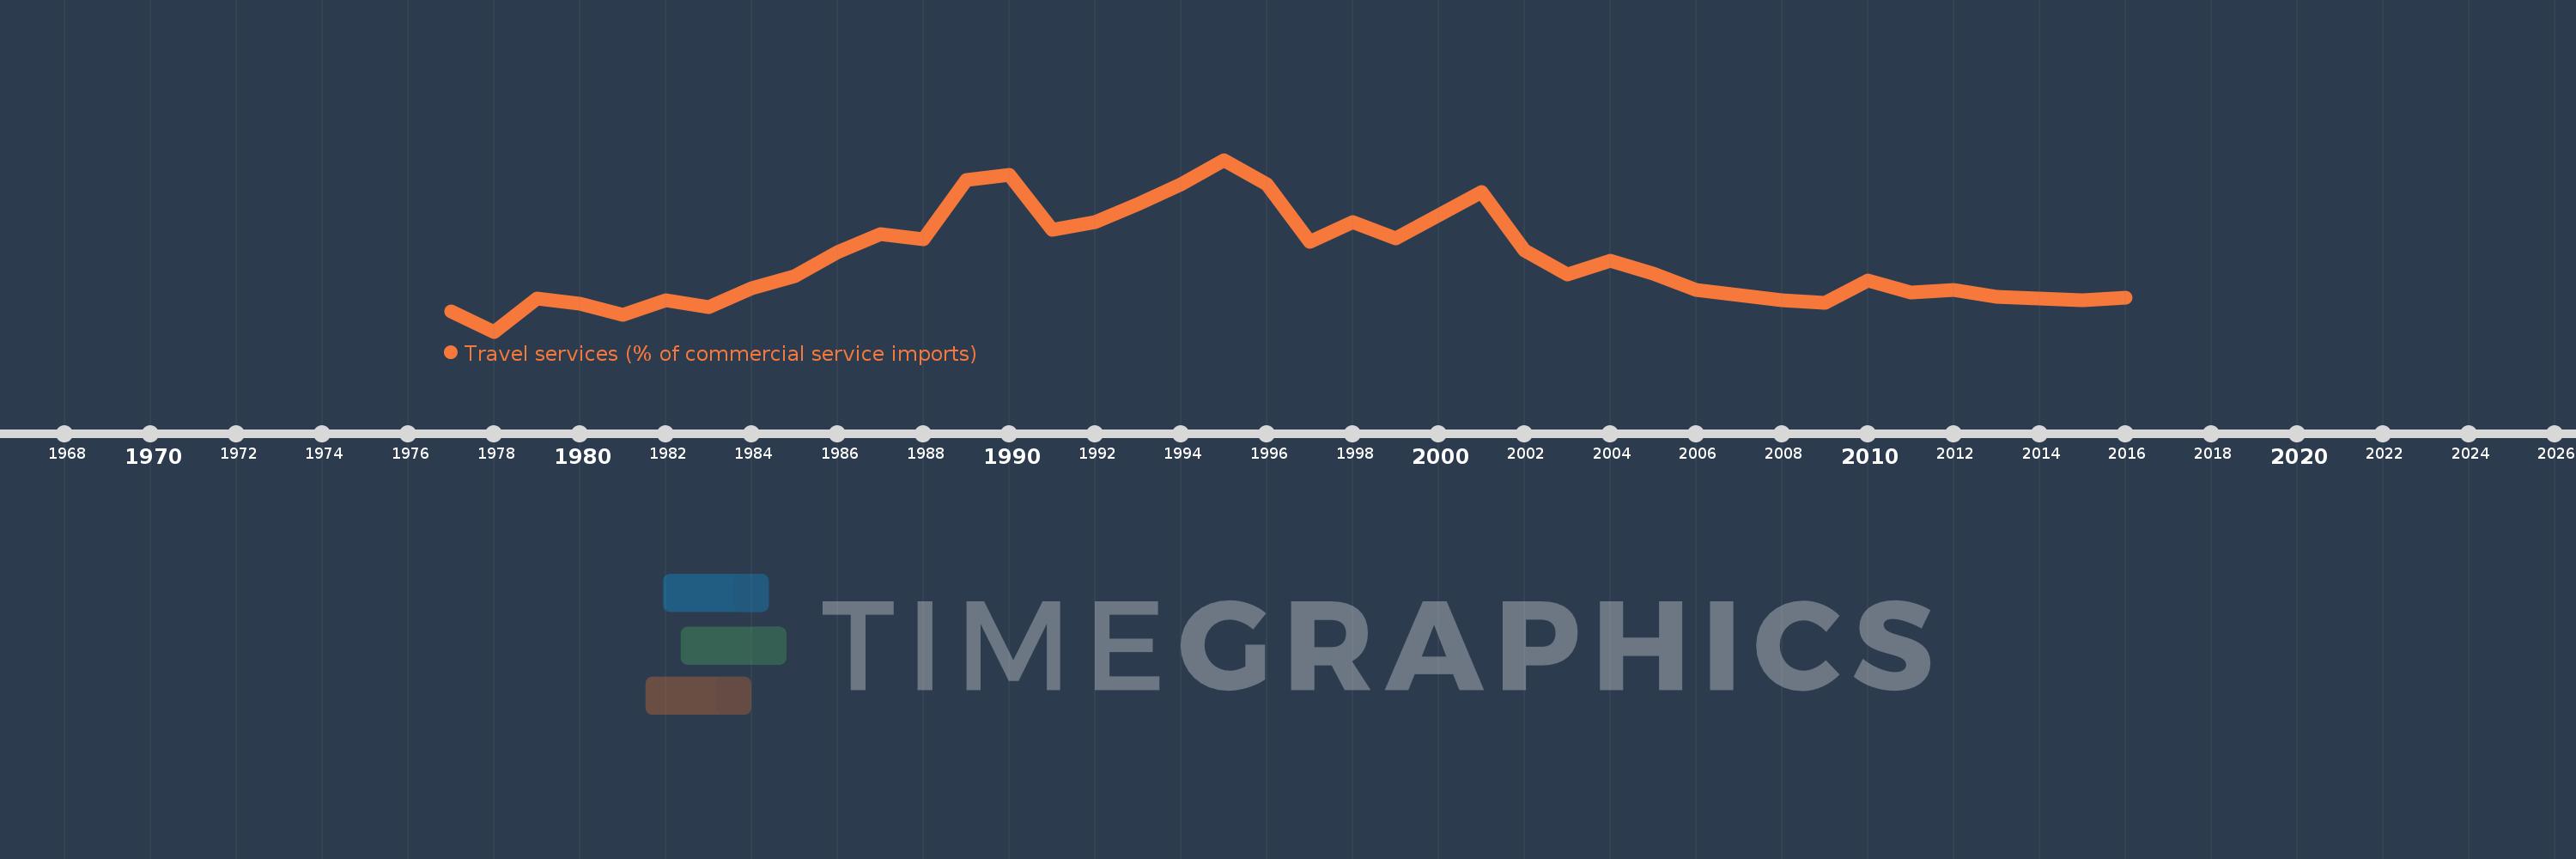
Travel services (% of commercial service imports)
2016,2015,2014,2013,2012,2011,2010,2009,2008,2007,2006,2005,2004,2003,2002,2001,2000,1999,1998,1997,1996,1995,1994,1993,1992,1991,1990,1989,1988,1987,1986,1985,1984,1983,1982,1981,1980,1979,1978,1977
Estas estadísticas en otros países:
AfghanistanAlbaniaAlgeriaAngolaAntigua and BarbudaArab WorldArgentinaArmeniaArubaAustraliaAustriaAzerbaijanBahamas, TheBahrainBangladeshBarbadosBelarusBelgiumBelizeBeninBermudaBhutanBoliviaBosnia and HerzegovinaBotswanaBrazilBrunei DarussalamBulgariaBurkina FasoBurundiCabo VerdeCambodiaCameroonCanadaCaribbean small statesCentral African RepublicCentral Europe and the BalticsChadChileChinaColombiaComorosCongo, Dem. Rep.Congo, Rep.Costa RicaCote d'IvoireCroatiaCuracaoCyprusCzech RepublicDenmarkDjiboutiDominicaDominican RepublicEarly-demographic dividendEast Asia & PacificEast Asia & Pacific (excluding high income)East Asia & Pacific (IDA & IBRD countries)EcuadorEgypt, Arab Rep.El SalvadorEritreaEstoniaEthiopiaEuro areaEurope & Central AsiaEurope & Central Asia (excluding high income)Europe & Central Asia (IDA & IBRD countries)European UnionFaroe IslandsFijiFinlandFragile and conflict affected situationsFranceFrench PolynesiaGabonGambia, TheGeorgiaGermanyGhanaGreeceGrenadaGuatemalaGuineaGuinea-BissauGuyanaHaitiHeavily indebted poor countries (HIPC)High incomeHondurasHong Kong SAR, ChinaHungaryIBRD onlyIcelandIDA & IBRD totalIDA onlyIDA totalIndiaIndonesiaIran, Islamic Rep.IraqIrelandIsraelItalyJamaicaJapanJordanKazakhstanKenyaKiribatiKorea, Rep.KosovoKuwaitKyrgyz RepublicLao PDRLate-demographic dividendLatin America & Caribbean Latin America & Caribbean (excluding high income)Latin America & the Caribbean (IDA & IBRD countries)LatviaLeast developed countries: UN classificationLebanonLesothoLiberiaLibyaLithuaniaLow & middle incomeLow incomeLower middle incomeLuxembourgMacao SAR, ChinaMacedonia, FYRMadagascarMalawiMalaysiaMaldivesMaliMaltaMarshall IslandsMauritaniaMauritiusMexicoMicronesia, Fed. Sts.Middle East & North AfricaMiddle East & North Africa (excluding high income)Middle East & North Africa (IDA & IBRD countries)Middle incomeMoldovaMongoliaMontenegroMoroccoMozambiqueMyanmarNamibiaNepalNetherlandsNew CaledoniaNew ZealandNicaraguaNigerNigeriaNorth AmericaNorwayOECD membersOmanOther small statesPacific island small statesPakistanPalauPanamaPapua New GuineaParaguayPeruPhilippinesPolandPortugalPost-demographic dividendPre-demographic dividendQatarRomaniaRussian FederationRwandaSamoaSao Tome and PrincipeSaudi ArabiaSenegalSerbiaSeychellesSierra LeoneSingaporeSint Maarten (Dutch part)Slovak RepublicSloveniaSmall statesSolomon IslandsSouth AfricaSouth AsiaSouth Asia (IDA & IBRD)South SudanSpainSri LankaSt. Kitts and NevisSt. LuciaSt. Vincent and the GrenadinesSub-Saharan Africa Sub-Saharan Africa (excluding high income)Sub-Saharan Africa (IDA & IBRD countries)SudanSurinameSwazilandSwedenSwitzerlandSyrian Arab RepublicTajikistanTanzaniaThailandTimor-LesteTogoTongaTrinidad and TobagoTunisiaTurkeyTuvaluUgandaUkraineUnited KingdomUnited StatesUpper middle incomeUruguayVanuatuVenezuela, RBWest Bank and GazaWorldYemen, Rep.ZambiaZimbabwe línea de tiempo (timeline):
En esta escala de tiempo se presenta un gráfico de 1977 y 2016 de Bangladesh. Los datos de 1976 están ausentes. El número de observaciones reales por fecha: 40.
Fuente (nombre):
Indicadores del desarrollo mundial
Fuente (organización):
International Monetary Fund, Balance of Payments Statistics Yearbook and data files.
Categorías:
Private Sector, Trade
Se ha actualizado:
23 abr 2017 año
Los indicadores de los cambios de valor en los últimos años
Mínimo:
1.594
1 ene 1978 año
Máximo:
22.604
1 ene 1995 año
A la fecha de observación
Valor
Cambio absoluto
El cambio con respecto al valor anterior
1 ene 1977 año
4.058
+4.058
0.0%
1 ene 1978 año
1.594
-2.465
-60.73%
1 ene 1979 año
5.596
+4.003
251.16%
1 ene 1980 año
4.968
-0.628
-11.22%
1 ene 1981 año
3.623
-1.345
-27.08%
1 ene 1982 año
5.429
+1.806
49.84%
1 ene 1983 año
4.63
-0.799
-14.71%
1 ene 1984 año
6.938
+2.308
49.85%
1 ene 1985 año
8.355
+1.417
20.42%
1 ene 1986 año
11.309
+2.954
35.35%
1 ene 1987 año
13.478
+2.169
19.18%
1 ene 1988 año
12.906
-0.572
-4.24%
1 ene 1989 año
20.088
+7.182
55.65%
1 ene 1990 año
20.729
+0.641
3.19%
1 ene 1991 año
14.065
-6.664
-32.15%
1 ene 1992 año
14.941
+0.876
6.23%
1 ene 1993 año
17.206
+2.265
15.16%
1 ene 1994 año
19.606
+2.401
13.95%
1 ene 1995 año
22.604
+2.998
15.29%
1 ene 1996 año
19.586
-3.018
-13.35%
1 ene 1997 año
12.527
-7.058
-36.04%
1 ene 1998 año
15.003
+2.476
19.76%
1 ene 1999 año
12.941
-2.062
-13.74%
1 ene 2000 año
15.805
+2.864
22.13%
1 ene 2001 año
18.694
+2.888
18.28%
1 ene 2002 año
11.483
-7.211
-38.57%
1 ene 2003 año
8.54
-2.943
-25.63%
1 ene 2004 año
10.303
+1.764
20.65%
1 ene 2005 año
8.666
-1.638
-15.9%
1 ene 2006 año
6.7
-1.965
-22.68%
1 ene 2007 año
6.048
-0.653
-9.74%
1 ene 2008 año
5.423
-0.624
-10.32%
1 ene 2009 año
5.117
-0.306
-5.65%
1 ene 2010 año
7.824
+2.708
52.91%
1 ene 2011 año
6.322
-1.502
-19.2%
1 ene 2012 año
6.663
+0.341
5.4%
1 ene 2013 año
5.812
-0.851
-12.78%
1 ene 2014 año
5.65
-0.162
-2.79%
1 ene 2015 año
5.401
-0.249
-4.41%
1 ene 2016 año
5.761
+0.36
6.67%
Ranking de los países por los datos estadísticos actuales


Comentarios: