29
/es/
es
AIzaSyAYiBZKx7MnpbEhh9jyipgxe19OcubqV5w
April 1, 2024
253771
Sudan
SDN
true
2
1
Travel services (% of commercial service imports)
2016,2015,2014,2013,2012,2011,2010,2009,2008,2007,2006,2005,2004,2003,2002,2001,2000,1999,1998,1997,1996,1995,1994,1993,1992,1991,1990,1989,1988,1987,1986,1985,1984,1983,1982,1981,1980,1979,1978
Estas estadísticas en otros países:
AfghanistanAlbaniaAlgeriaAngolaAntigua and BarbudaArab WorldArgentinaArmeniaArubaAustraliaAustriaAzerbaijanBahamas, TheBahrainBangladeshBarbadosBelarusBelgiumBelizeBeninBermudaBhutanBoliviaBosnia and HerzegovinaBotswanaBrazilBrunei DarussalamBulgariaBurkina FasoBurundiCabo VerdeCambodiaCameroonCanadaCaribbean small statesCentral African RepublicCentral Europe and the BalticsChadChileChinaColombiaComorosCongo, Dem. Rep.Congo, Rep.Costa RicaCote d'IvoireCroatiaCuracaoCyprusCzech RepublicDenmarkDjiboutiDominicaDominican RepublicEarly-demographic dividendEast Asia & PacificEast Asia & Pacific (excluding high income)East Asia & Pacific (IDA & IBRD countries)EcuadorEgypt, Arab Rep.El SalvadorEritreaEstoniaEthiopiaEuro areaEurope & Central AsiaEurope & Central Asia (excluding high income)Europe & Central Asia (IDA & IBRD countries)European UnionFaroe IslandsFijiFinlandFragile and conflict affected situationsFranceFrench PolynesiaGabonGambia, TheGeorgiaGermanyGhanaGreeceGrenadaGuatemalaGuineaGuinea-BissauGuyanaHaitiHeavily indebted poor countries (HIPC)High incomeHondurasHong Kong SAR, ChinaHungaryIBRD onlyIcelandIDA & IBRD totalIDA onlyIDA totalIndiaIndonesiaIran, Islamic Rep.IraqIrelandIsraelItalyJamaicaJapanJordanKazakhstanKenyaKiribatiKorea, Rep.KosovoKuwaitKyrgyz RepublicLao PDRLate-demographic dividendLatin America & Caribbean Latin America & Caribbean (excluding high income)Latin America & the Caribbean (IDA & IBRD countries)LatviaLeast developed countries: UN classificationLebanonLesothoLiberiaLibyaLithuaniaLow & middle incomeLow incomeLower middle incomeLuxembourgMacao SAR, ChinaMacedonia, FYRMadagascarMalawiMalaysiaMaldivesMaliMaltaMarshall IslandsMauritaniaMauritiusMexicoMicronesia, Fed. Sts.Middle East & North AfricaMiddle East & North Africa (excluding high income)Middle East & North Africa (IDA & IBRD countries)Middle incomeMoldovaMongoliaMontenegroMoroccoMozambiqueMyanmarNamibiaNepalNetherlandsNew CaledoniaNew ZealandNicaraguaNigerNigeriaNorth AmericaNorwayOECD membersOmanOther small statesPacific island small statesPakistanPalauPanamaPapua New GuineaParaguayPeruPhilippinesPolandPortugalPost-demographic dividendPre-demographic dividendQatarRomaniaRussian FederationRwandaSamoaSao Tome and PrincipeSaudi ArabiaSenegalSerbiaSeychellesSierra LeoneSingaporeSint Maarten (Dutch part)Slovak RepublicSloveniaSmall statesSolomon IslandsSouth AfricaSouth AsiaSouth Asia (IDA & IBRD)South SudanSpainSri LankaSt. Kitts and NevisSt. LuciaSt. Vincent and the GrenadinesSub-Saharan Africa Sub-Saharan Africa (excluding high income)Sub-Saharan Africa (IDA & IBRD countries)SudanSurinameSwazilandSwedenSwitzerlandSyrian Arab RepublicTajikistanTanzaniaThailandTimor-LesteTogoTongaTrinidad and TobagoTunisiaTurkeyTuvaluUgandaUkraineUnited KingdomUnited StatesUpper middle incomeUruguayVanuatuVenezuela, RBWest Bank and GazaWorldYemen, Rep.ZambiaZimbabwe línea de tiempo (timeline):
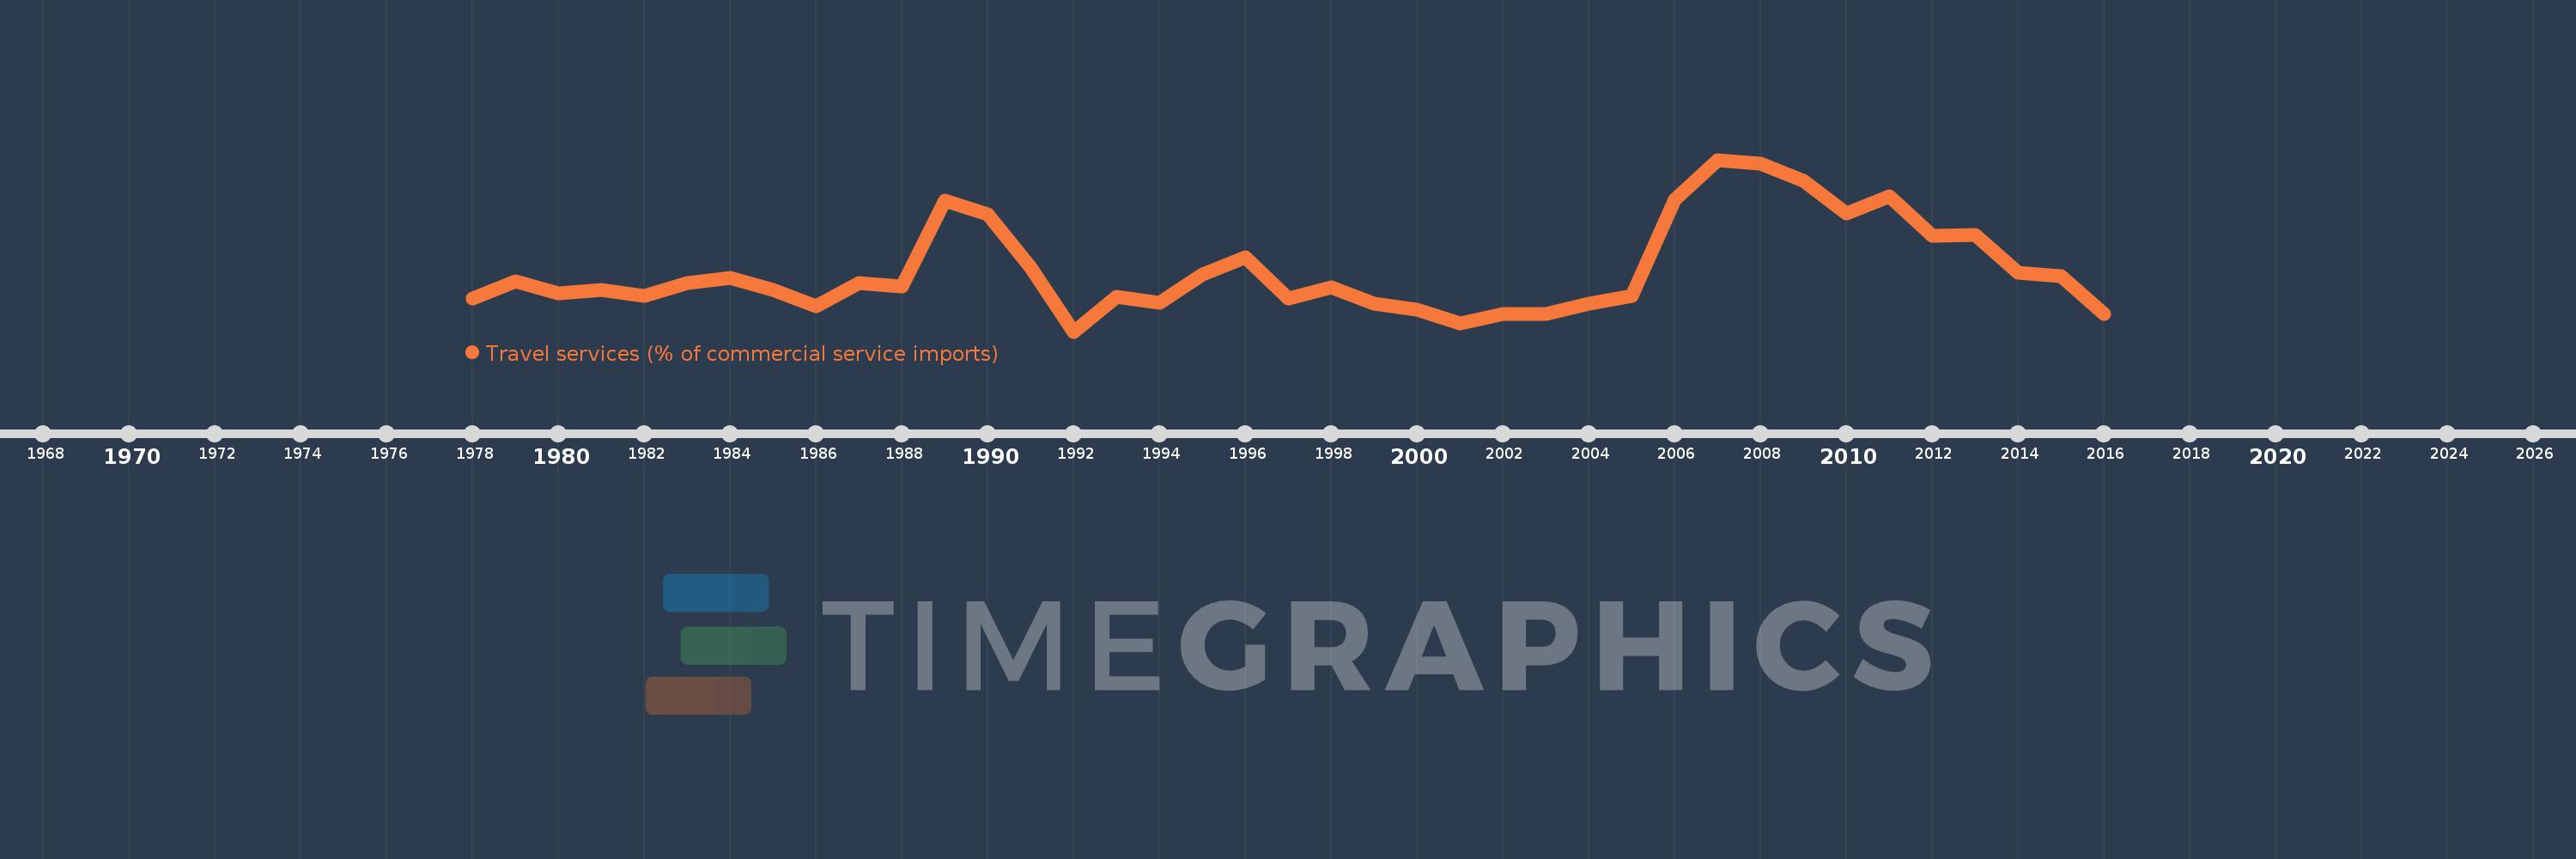
En esta escala de tiempo se presenta un gráfico de 1978 y 2016 de Sudan. Los datos de 1977 están ausentes. El número de observaciones reales por fecha: 39.
Fuente (nombre):
Indicadores del desarrollo mundial
Fuente (organización):
International Monetary Fund, Balance of Payments Statistics Yearbook and data files.
Categorías:
Private Sector, Trade
Se ha actualizado:
23 abr 2017 año
Los indicadores de los cambios de valor en los últimos años
Mínimo:
6.453
1 ene 1992 año
Máximo:
57.63
1 ene 2007 año
A la fecha de observación
Valor
Cambio absoluto
El cambio con respecto al valor anterior
1 ene 1978 año
16.286
+16.286
0.0%
1 ene 1979 año
21.341
+5.055
31.04%
1 ene 1980 año
17.931
-3.41
-15.98%
1 ene 1981 año
18.794
+0.863
4.81%
1 ene 1982 año
17.2
-1.593
-8.48%
1 ene 1983 año
20.87
+3.669
21.33%
1 ene 1984 año
22.381
+1.512
7.24%
1 ene 1985 año
18.778
-3.603
-16.1%
1 ene 1986 año
13.96
-4.818
-25.66%
1 ene 1987 año
20.948
+6.988
50.05%
1 ene 1988 año
19.796
-1.152
-5.5%
1 ene 1989 año
45.375
+25.579
129.21%
1 ene 1990 año
41.408
-3.967
-8.74%
1 ene 1991 año
25.42
-15.988
-38.61%
1 ene 1992 año
6.453
-18.967
-74.61%
1 ene 1993 año
16.904
+10.45
161.93%
1 ene 1994 año
14.953
-1.95
-11.54%
1 ene 1995 año
23.544
+8.591
57.45%
1 ene 1996 año
28.696
+5.151
21.88%
1 ene 1997 año
16.413
-12.283
-42.8%
1 ene 1998 año
19.75
+3.337
20.33%
1 ene 1999 año
14.671
-5.079
-25.72%
1 ene 2000 año
13.014
-1.656
-11.29%
1 ene 2001 año
8.766
-4.249
-32.65%
1 ene 2002 año
11.628
+2.862
32.65%
1 ene 2003 año
11.658
+0.029
0.25%
1 ene 2004 año
14.802
+3.144
26.97%
1 ene 2005 año
17.159
+2.357
15.93%
1 ene 2006 año
45.725
+28.567
166.48%
1 ene 2007 año
57.63
+11.905
26.03%
1 ene 2008 año
56.469
-1.161
-2.01%
1 ene 2009 año
51.436
-5.033
-8.91%
1 ene 2010 año
41.753
-9.684
-18.83%
1 ene 2011 año
46.82
+5.068
12.14%
1 ene 2012 año
34.887
-11.933
-25.49%
1 ene 2013 año
35.235
+0.347
1.0%
1 ene 2014 año
23.917
-11.318
-32.12%
1 ene 2015 año
22.892
-1.025
-4.29%
1 ene 2016 año
11.648
-11.244
-49.12%
Ranking de los países por los datos estadísticos actuales


Comentarios: