29
/es/
es
AIzaSyAYiBZKx7MnpbEhh9jyipgxe19OcubqV5w
April 1, 2024
234281
Sao Tome and Principe
STP
true
2
1
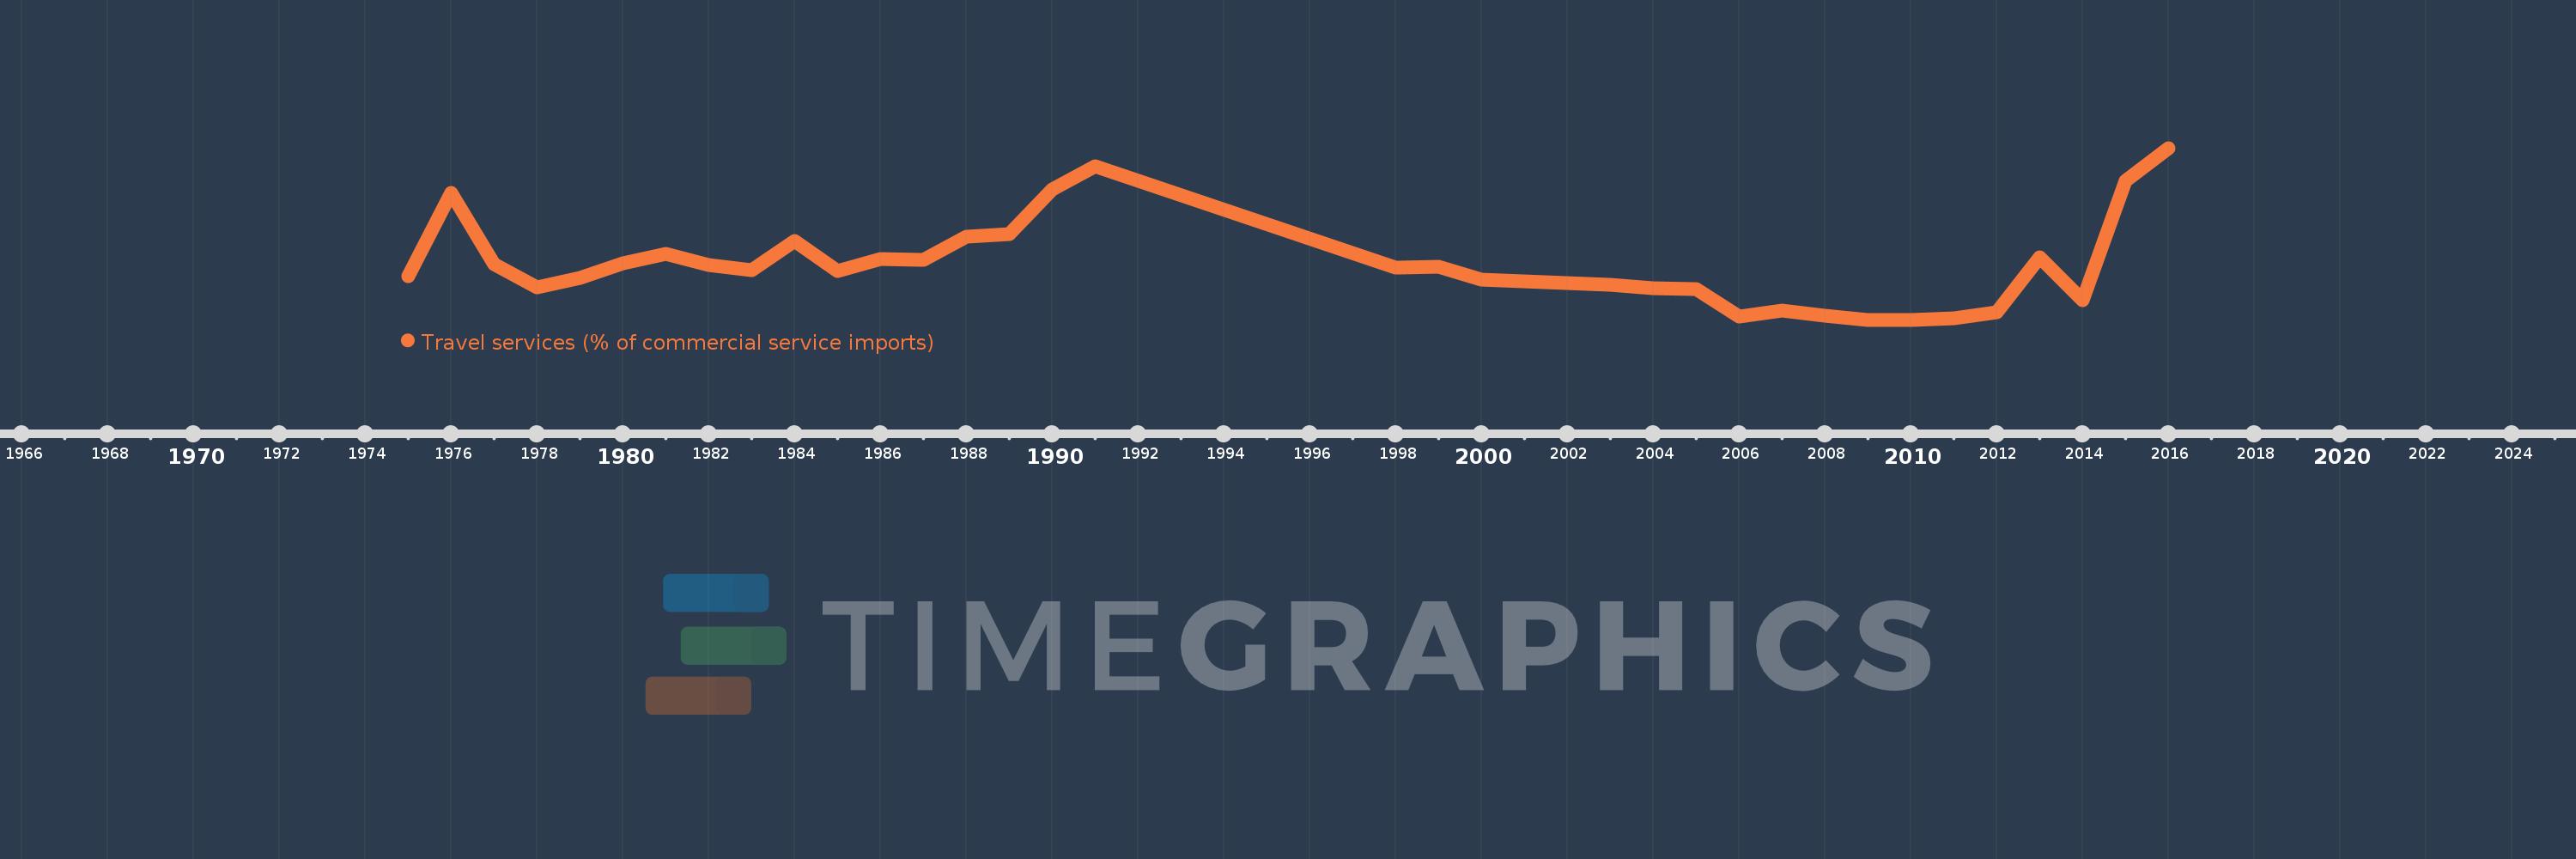
Travel services (% of commercial service imports)
2016,2015,2014,2013,2012,2011,2010,2009,2008,2007,2006,2005,2004,2003,2002,2001,2000,1999,1998,1991,1990,1989,1988,1987,1986,1985,1984,1983,1982,1981,1980,1979,1978,1977,1976,1975
Estas estadísticas en otros países:
AfghanistanAlbaniaAlgeriaAngolaAntigua and BarbudaArab WorldArgentinaArmeniaArubaAustraliaAustriaAzerbaijanBahamas, TheBahrainBangladeshBarbadosBelarusBelgiumBelizeBeninBermudaBhutanBoliviaBosnia and HerzegovinaBotswanaBrazilBrunei DarussalamBulgariaBurkina FasoBurundiCabo VerdeCambodiaCameroonCanadaCaribbean small statesCentral African RepublicCentral Europe and the BalticsChadChileChinaColombiaComorosCongo, Dem. Rep.Congo, Rep.Costa RicaCote d'IvoireCroatiaCuracaoCyprusCzech RepublicDenmarkDjiboutiDominicaDominican RepublicEarly-demographic dividendEast Asia & PacificEast Asia & Pacific (excluding high income)East Asia & Pacific (IDA & IBRD countries)EcuadorEgypt, Arab Rep.El SalvadorEritreaEstoniaEthiopiaEuro areaEurope & Central AsiaEurope & Central Asia (excluding high income)Europe & Central Asia (IDA & IBRD countries)European UnionFaroe IslandsFijiFinlandFragile and conflict affected situationsFranceFrench PolynesiaGabonGambia, TheGeorgiaGermanyGhanaGreeceGrenadaGuatemalaGuineaGuinea-BissauGuyanaHaitiHeavily indebted poor countries (HIPC)High incomeHondurasHong Kong SAR, ChinaHungaryIBRD onlyIcelandIDA & IBRD totalIDA onlyIDA totalIndiaIndonesiaIran, Islamic Rep.IraqIrelandIsraelItalyJamaicaJapanJordanKazakhstanKenyaKiribatiKorea, Rep.KosovoKuwaitKyrgyz RepublicLao PDRLate-demographic dividendLatin America & Caribbean Latin America & Caribbean (excluding high income)Latin America & the Caribbean (IDA & IBRD countries)LatviaLeast developed countries: UN classificationLebanonLesothoLiberiaLibyaLithuaniaLow & middle incomeLow incomeLower middle incomeLuxembourgMacao SAR, ChinaMacedonia, FYRMadagascarMalawiMalaysiaMaldivesMaliMaltaMarshall IslandsMauritaniaMauritiusMexicoMicronesia, Fed. Sts.Middle East & North AfricaMiddle East & North Africa (excluding high income)Middle East & North Africa (IDA & IBRD countries)Middle incomeMoldovaMongoliaMontenegroMoroccoMozambiqueMyanmarNamibiaNepalNetherlandsNew CaledoniaNew ZealandNicaraguaNigerNigeriaNorth AmericaNorwayOECD membersOmanOther small statesPacific island small statesPakistanPalauPanamaPapua New GuineaParaguayPeruPhilippinesPolandPortugalPost-demographic dividendPre-demographic dividendQatarRomaniaRussian FederationRwandaSamoaSao Tome and PrincipeSaudi ArabiaSenegalSerbiaSeychellesSierra LeoneSingaporeSint Maarten (Dutch part)Slovak RepublicSloveniaSmall statesSolomon IslandsSouth AfricaSouth AsiaSouth Asia (IDA & IBRD)South SudanSpainSri LankaSt. Kitts and NevisSt. LuciaSt. Vincent and the GrenadinesSub-Saharan Africa Sub-Saharan Africa (excluding high income)Sub-Saharan Africa (IDA & IBRD countries)SudanSurinameSwazilandSwedenSwitzerlandSyrian Arab RepublicTajikistanTanzaniaThailandTimor-LesteTogoTongaTrinidad and TobagoTunisiaTurkeyTuvaluUgandaUkraineUnited KingdomUnited StatesUpper middle incomeUruguayVanuatuVenezuela, RBWest Bank and GazaWorldYemen, Rep.ZambiaZimbabwe línea de tiempo (timeline):
En esta escala de tiempo se presenta un gráfico de 1975 y 2016 de Sao Tome and Principe. Los datos de 1974 están ausentes. El número de observaciones reales por fecha: 36.
Fuente (nombre):
Indicadores del desarrollo mundial
Fuente (organización):
International Monetary Fund, Balance of Payments Statistics Yearbook and data files.
Categorías:
Private Sector, Trade
Se ha actualizado:
23 abr 2017 año
Los indicadores de los cambios de valor en los últimos años
Mínimo:
0.071
1 ene 2010 año
Máximo:
26.863
1 ene 2016 año
A la fecha de observación
Valor
Cambio absoluto
El cambio con respecto al valor anterior
1 ene 1975 año
6.876
+6.876
0.0%
1 ene 1976 año
19.871
+12.995
188.98%
1 ene 1977 año
8.803
-11.068
-55.7%
1 ene 1978 año
5.075
-3.728
-42.35%
1 ene 1979 año
6.655
+1.58
31.13%
1 ene 1980 año
8.846
+2.191
32.92%
1 ene 1981 año
10.364
+1.519
17.17%
1 ene 1982 año
8.628
-1.736
-16.75%
1 ene 1983 año
7.824
-0.804
-9.32%
1 ene 1984 año
12.396
+4.573
58.45%
1 ene 1985 año
7.724
-4.672
-37.69%
1 ene 1986 año
9.553
+1.829
23.68%
1 ene 1987 año
9.45
-0.103
-1.08%
1 ene 1988 año
13.02
+3.57
37.78%
1 ene 1989 año
13.418
+0.397
3.05%
1 ene 1990 año
20.375
+6.957
51.85%
1 ene 1991 año
24.06
+3.685
18.09%
1 ene 1998 año
8.193
-15.867
-65.95%
1 ene 1999 año
8.316
+0.123
1.5%
1 ene 2000 año
6.366
-1.95
-23.45%
1 ene 2001 año
6.019
-0.347
-5.45%
1 ene 2002 año
5.837
-0.183
-3.03%
1 ene 2003 año
5.474
-0.363
-6.22%
1 ene 2004 año
4.922
-0.552
-10.08%
1 ene 2005 año
4.865
-0.057
-1.16%
1 ene 2006 año
0.532
-4.333
-89.07%
1 ene 2007 año
1.544
+1.012
190.27%
1 ene 2008 año
0.688
-0.855
-55.42%
1 ene 2009 año
0.079
-0.61
-88.57%
1 ene 2010 año
0.071
-0.008
-9.68%
1 ene 2011 año
0.241
+0.17
239.6%
1 ene 2012 año
1.289
+1.048
434.38%
1 ene 2013 año
9.836
+8.547
662.98%
1 ene 2014 año
3.046
-6.79
-69.03%
1 ene 2015 año
21.682
+18.636
611.76%
1 ene 2016 año
26.863
+5.18
23.89%
Ranking de los países por los datos estadísticos actuales


Comentarios: