29
/es/
es
AIzaSyAYiBZKx7MnpbEhh9jyipgxe19OcubqV5w
April 1, 2024
35456
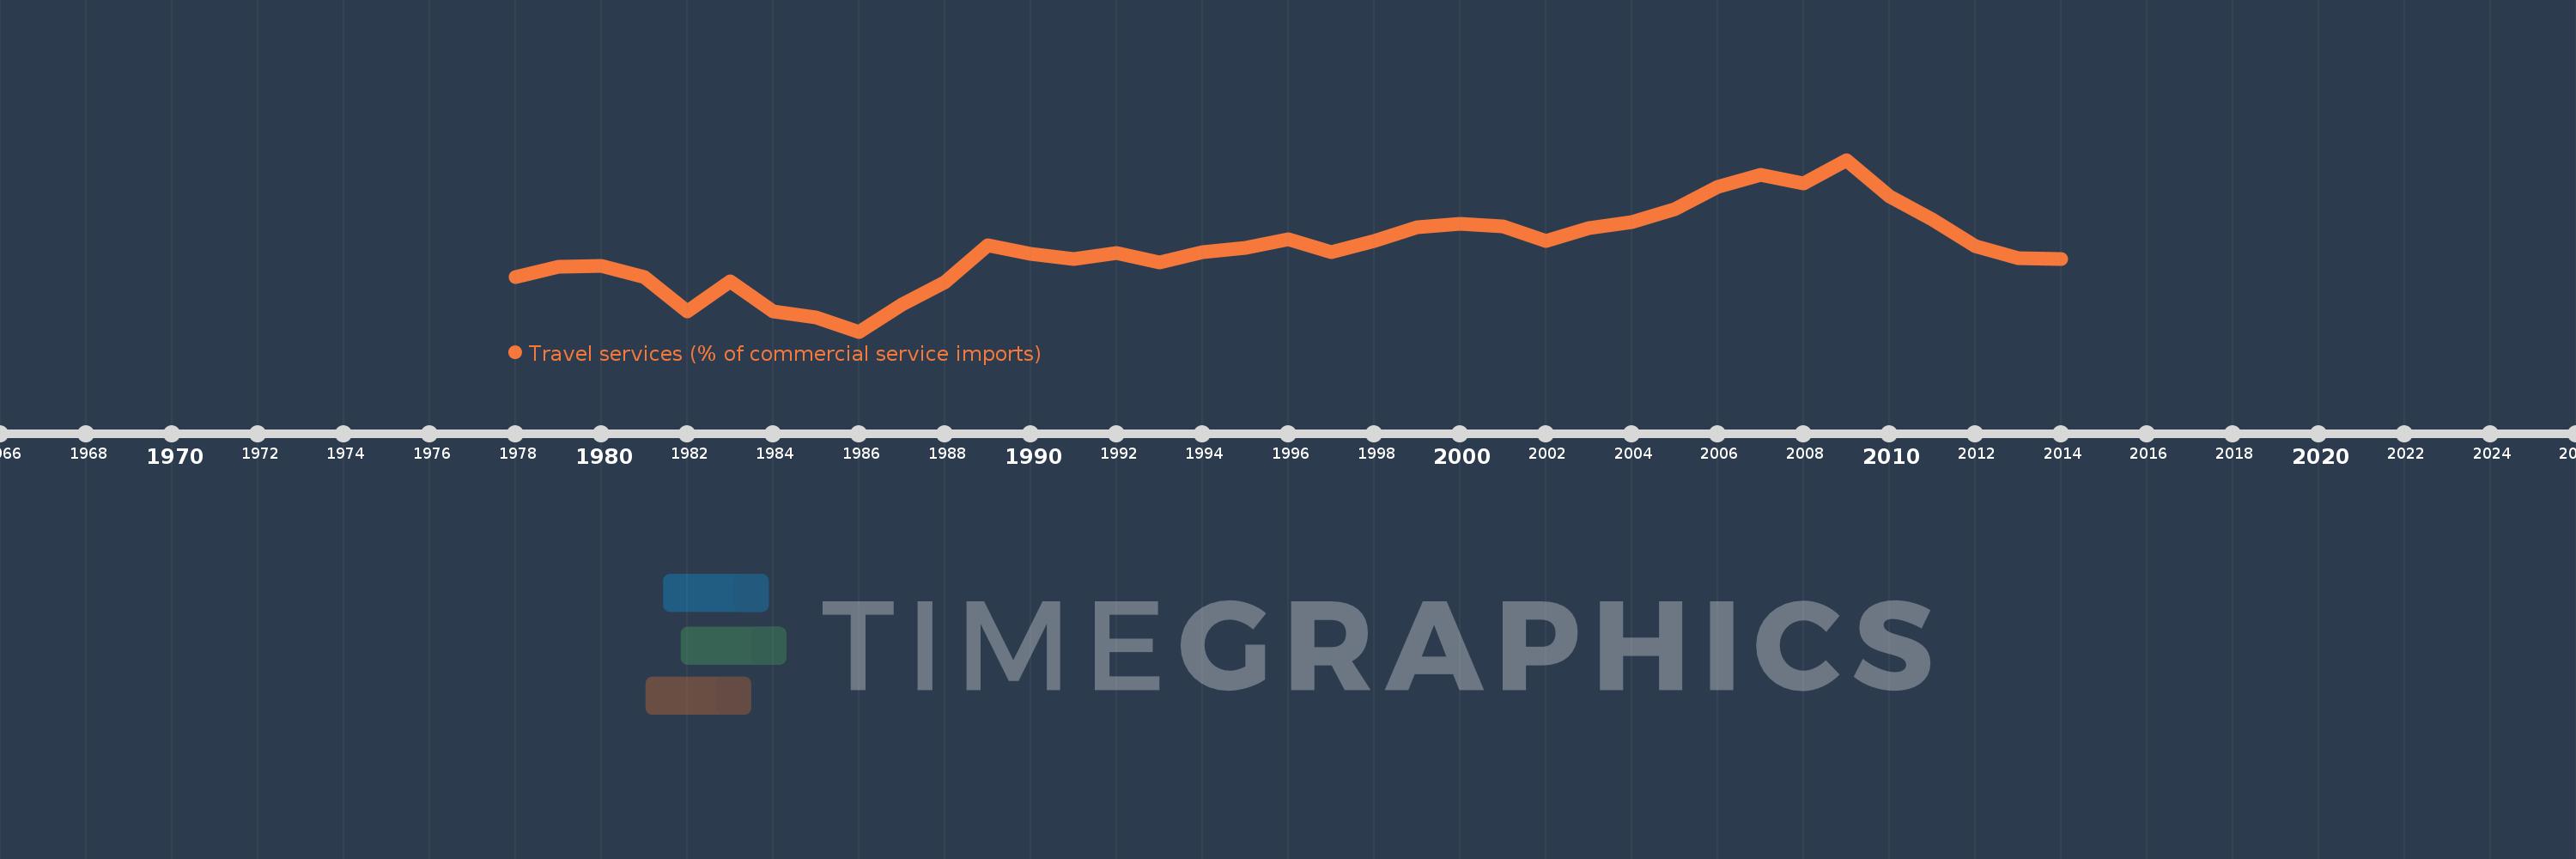
Heavily indebted poor countries (HIPC)
HPC
false
2
1
Travel services (% of commercial service imports)
2014,2013,2012,2011,2010,2009,2008,2007,2006,2005,2004,2003,2002,2001,2000,1999,1998,1997,1996,1995,1994,1993,1992,1991,1990,1989,1988,1987,1986,1985,1984,1983,1982,1981,1980,1979,1978
Estas estadísticas en otros países:
AfghanistanAlbaniaAlgeriaAngolaAntigua and BarbudaArab WorldArgentinaArmeniaArubaAustraliaAustriaAzerbaijanBahamas, TheBahrainBangladeshBarbadosBelarusBelgiumBelizeBeninBermudaBhutanBoliviaBosnia and HerzegovinaBotswanaBrazilBrunei DarussalamBulgariaBurkina FasoBurundiCabo VerdeCambodiaCameroonCanadaCaribbean small statesCentral African RepublicCentral Europe and the BalticsChadChileChinaColombiaComorosCongo, Dem. Rep.Congo, Rep.Costa RicaCote d'IvoireCroatiaCuracaoCyprusCzech RepublicDenmarkDjiboutiDominicaDominican RepublicEarly-demographic dividendEast Asia & PacificEast Asia & Pacific (excluding high income)East Asia & Pacific (IDA & IBRD countries)EcuadorEgypt, Arab Rep.El SalvadorEritreaEstoniaEthiopiaEuro areaEurope & Central AsiaEurope & Central Asia (excluding high income)Europe & Central Asia (IDA & IBRD countries)European UnionFaroe IslandsFijiFinlandFragile and conflict affected situationsFranceFrench PolynesiaGabonGambia, TheGeorgiaGermanyGhanaGreeceGrenadaGuatemalaGuineaGuinea-BissauGuyanaHaitiHeavily indebted poor countries (HIPC)High incomeHondurasHong Kong SAR, ChinaHungaryIBRD onlyIcelandIDA & IBRD totalIDA onlyIDA totalIndiaIndonesiaIran, Islamic Rep.IraqIrelandIsraelItalyJamaicaJapanJordanKazakhstanKenyaKiribatiKorea, Rep.KosovoKuwaitKyrgyz RepublicLao PDRLate-demographic dividendLatin America & Caribbean Latin America & Caribbean (excluding high income)Latin America & the Caribbean (IDA & IBRD countries)LatviaLeast developed countries: UN classificationLebanonLesothoLiberiaLibyaLithuaniaLow & middle incomeLow incomeLower middle incomeLuxembourgMacao SAR, ChinaMacedonia, FYRMadagascarMalawiMalaysiaMaldivesMaliMaltaMarshall IslandsMauritaniaMauritiusMexicoMicronesia, Fed. Sts.Middle East & North AfricaMiddle East & North Africa (excluding high income)Middle East & North Africa (IDA & IBRD countries)Middle incomeMoldovaMongoliaMontenegroMoroccoMozambiqueMyanmarNamibiaNepalNetherlandsNew CaledoniaNew ZealandNicaraguaNigerNigeriaNorth AmericaNorwayOECD membersOmanOther small statesPacific island small statesPakistanPalauPanamaPapua New GuineaParaguayPeruPhilippinesPolandPortugalPost-demographic dividendPre-demographic dividendQatarRomaniaRussian FederationRwandaSamoaSao Tome and PrincipeSaudi ArabiaSenegalSerbiaSeychellesSierra LeoneSingaporeSint Maarten (Dutch part)Slovak RepublicSloveniaSmall statesSolomon IslandsSouth AfricaSouth AsiaSouth Asia (IDA & IBRD)South SudanSpainSri LankaSt. Kitts and NevisSt. LuciaSt. Vincent and the GrenadinesSub-Saharan Africa Sub-Saharan Africa (excluding high income)Sub-Saharan Africa (IDA & IBRD countries)SudanSurinameSwazilandSwedenSwitzerlandSyrian Arab RepublicTajikistanTanzaniaThailandTimor-LesteTogoTongaTrinidad and TobagoTunisiaTurkeyTuvaluUgandaUkraineUnited KingdomUnited StatesUpper middle incomeUruguayVanuatuVenezuela, RBWest Bank and GazaWorldYemen, Rep.ZambiaZimbabwe línea de tiempo (timeline):
En esta escala de tiempo se presenta un gráfico de 1978 y 2014 de Heavily indebted poor countries (HIPC). Los datos de 1977 están ausentes. El número de observaciones reales por fecha: 37.
Fuente (nombre):
Indicadores del desarrollo mundial
Fuente (organización):
International Monetary Fund, Balance of Payments Statistics Yearbook and data files.
Categorías:
Private Sector, Trade
Se ha actualizado:
23 abr 2017 año
Los indicadores de los cambios de valor en los últimos años
Mínimo:
10.886
1 ene 1986 año
Máximo:
24.67
1 ene 2009 año
A la fecha de observación
Valor
Cambio absoluto
El cambio con respecto al valor anterior
1 ene 1978 año
15.251
+15.251
0.0%
1 ene 1979 año
16.122
+0.871
5.71%
1 ene 1980 año
16.171
+0.049
0.3%
1 ene 1981 año
15.244
-0.927
-5.73%
1 ene 1982 año
12.508
-2.735
-17.94%
1 ene 1983 año
14.93
+2.421
19.36%
1 ene 1984 año
12.522
-2.408
-16.13%
1 ene 1985 año
12.045
-0.477
-3.81%
1 ene 1986 año
10.886
-1.158
-9.62%
1 ene 1987 año
13.048
+2.161
19.85%
1 ene 1988 año
14.848
+1.801
13.8%
1 ene 1989 año
17.844
+2.996
20.17%
1 ene 1990 año
17.131
-0.713
-4.0%
1 ene 1991 año
16.687
-0.444
-2.59%
1 ene 1992 año
17.203
+0.516
3.09%
1 ene 1993 año
16.426
-0.777
-4.52%
1 ene 1994 año
17.238
+0.812
4.94%
1 ene 1995 año
17.626
+0.388
2.25%
1 ene 1996 año
18.324
+0.698
3.96%
1 ene 1997 año
17.249
-1.075
-5.86%
1 ene 1998 año
18.178
+0.928
5.38%
1 ene 1999 año
19.265
+1.087
5.98%
1 ene 2000 año
19.543
+0.278
1.44%
1 ene 2001 año
19.3
-0.243
-1.24%
1 ene 2002 año
18.189
-1.111
-5.76%
1 ene 2003 año
19.21
+1.022
5.62%
1 ene 2004 año
19.707
+0.497
2.58%
1 ene 2005 año
20.733
+1.026
5.21%
1 ene 2006 año
22.505
+1.771
8.54%
1 ene 2007 año
23.497
+0.992
4.41%
1 ene 2008 año
22.803
-0.694
-2.95%
1 ene 2009 año
24.67
+1.867
8.19%
1 ene 2010 año
21.707
-2.963
-12.01%
1 ene 2011 año
19.872
-1.835
-8.45%
1 ene 2012 año
17.737
-2.135
-10.75%
1 ene 2013 año
16.75
-0.986
-5.56%
1 ene 2014 año
16.691
-0.06
-0.36%
Ranking de los países por los datos estadísticos actuales


Comentarios: