29
/es/
es
AIzaSyAYiBZKx7MnpbEhh9jyipgxe19OcubqV5w
April 1, 2024
69357
Antigua and Barbuda
ATG
true
2
1
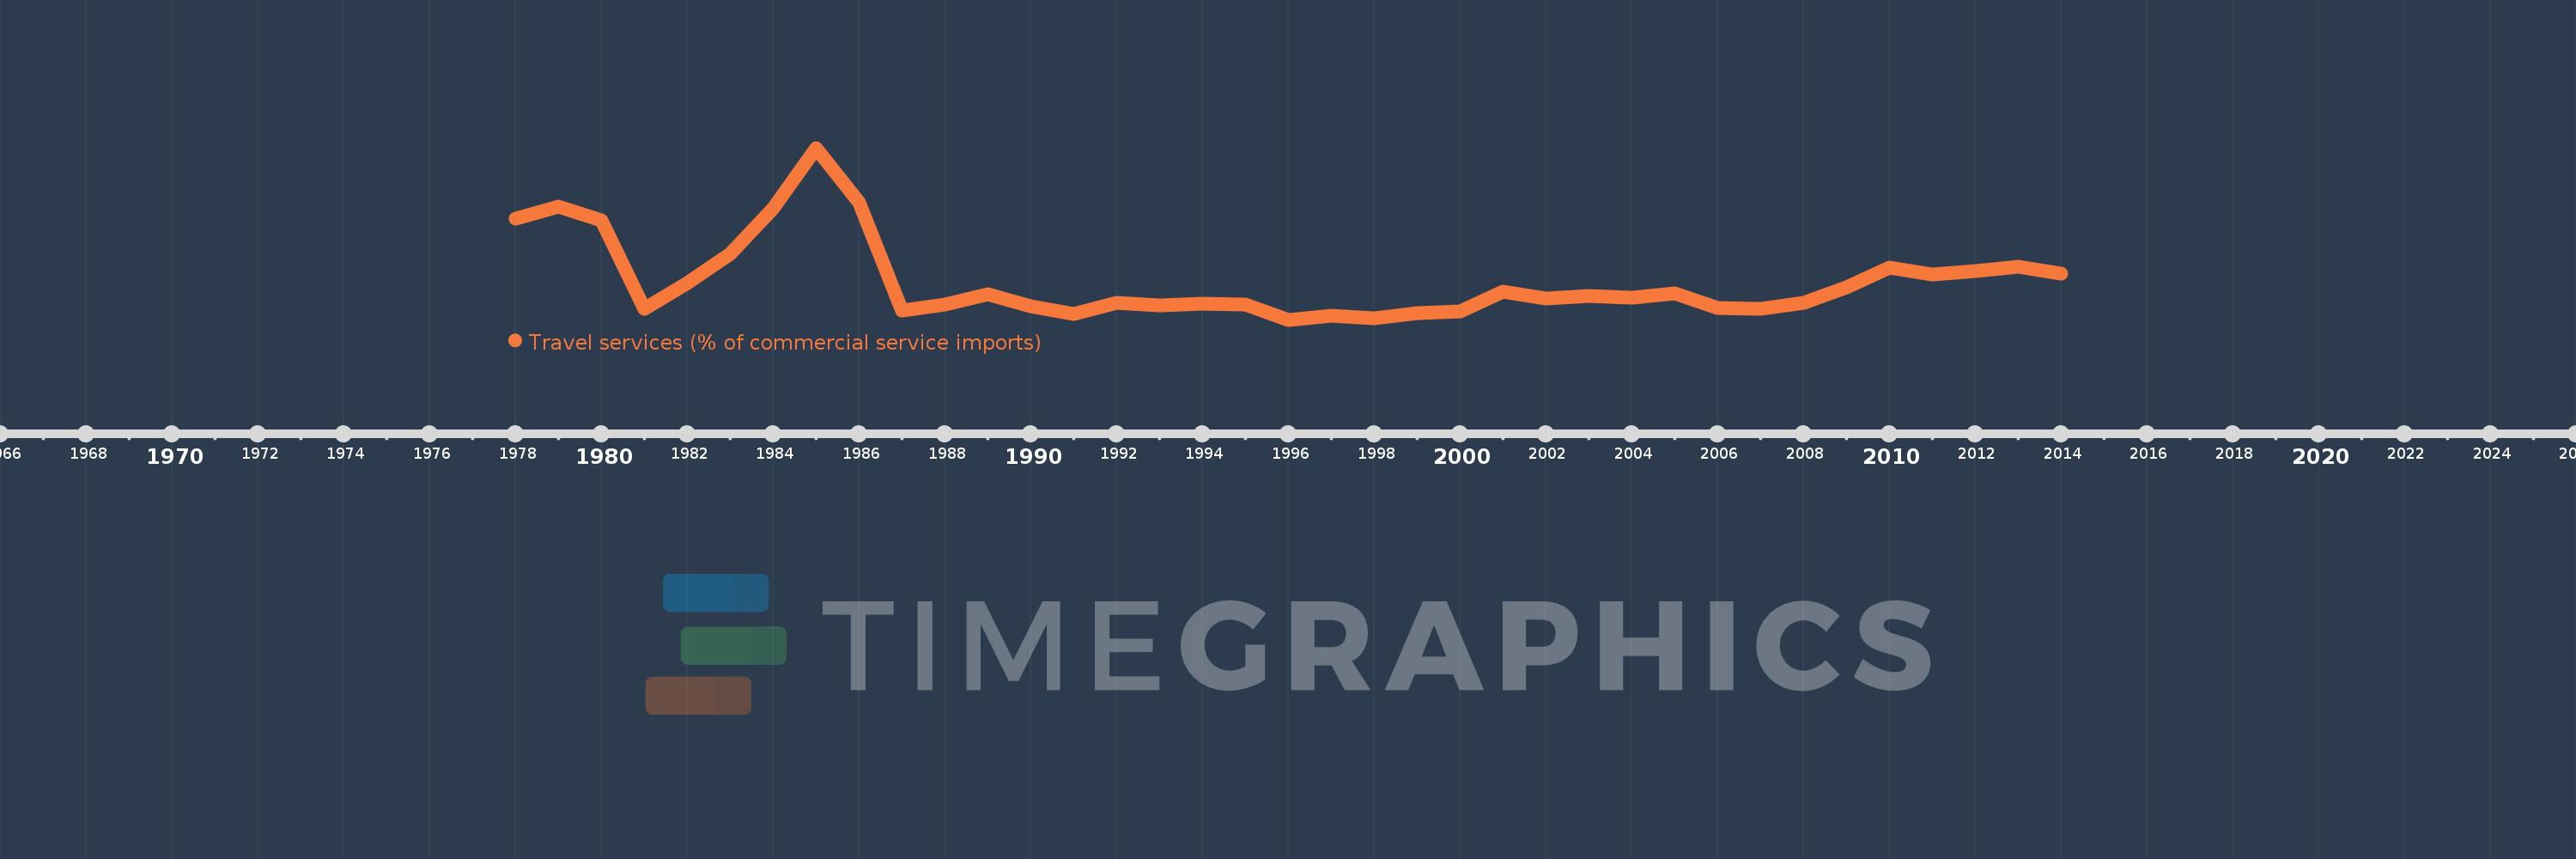
Travel services (% of commercial service imports)
2014,2013,2012,2011,2010,2009,2008,2007,2006,2005,2004,2003,2002,2001,2000,1999,1998,1997,1996,1995,1994,1993,1992,1991,1990,1989,1988,1987,1986,1985,1984,1983,1982,1981,1980,1979,1978
Estas estadísticas en otros países:
AfghanistanAlbaniaAlgeriaAngolaAntigua and BarbudaArab WorldArgentinaArmeniaArubaAustraliaAustriaAzerbaijanBahamas, TheBahrainBangladeshBarbadosBelarusBelgiumBelizeBeninBermudaBhutanBoliviaBosnia and HerzegovinaBotswanaBrazilBrunei DarussalamBulgariaBurkina FasoBurundiCabo VerdeCambodiaCameroonCanadaCaribbean small statesCentral African RepublicCentral Europe and the BalticsChadChileChinaColombiaComorosCongo, Dem. Rep.Congo, Rep.Costa RicaCote d'IvoireCroatiaCuracaoCyprusCzech RepublicDenmarkDjiboutiDominicaDominican RepublicEarly-demographic dividendEast Asia & PacificEast Asia & Pacific (excluding high income)East Asia & Pacific (IDA & IBRD countries)EcuadorEgypt, Arab Rep.El SalvadorEritreaEstoniaEthiopiaEuro areaEurope & Central AsiaEurope & Central Asia (excluding high income)Europe & Central Asia (IDA & IBRD countries)European UnionFaroe IslandsFijiFinlandFragile and conflict affected situationsFranceFrench PolynesiaGabonGambia, TheGeorgiaGermanyGhanaGreeceGrenadaGuatemalaGuineaGuinea-BissauGuyanaHaitiHeavily indebted poor countries (HIPC)High incomeHondurasHong Kong SAR, ChinaHungaryIBRD onlyIcelandIDA & IBRD totalIDA onlyIDA totalIndiaIndonesiaIran, Islamic Rep.IraqIrelandIsraelItalyJamaicaJapanJordanKazakhstanKenyaKiribatiKorea, Rep.KosovoKuwaitKyrgyz RepublicLao PDRLate-demographic dividendLatin America & Caribbean Latin America & Caribbean (excluding high income)Latin America & the Caribbean (IDA & IBRD countries)LatviaLeast developed countries: UN classificationLebanonLesothoLiberiaLibyaLithuaniaLow & middle incomeLow incomeLower middle incomeLuxembourgMacao SAR, ChinaMacedonia, FYRMadagascarMalawiMalaysiaMaldivesMaliMaltaMarshall IslandsMauritaniaMauritiusMexicoMicronesia, Fed. Sts.Middle East & North AfricaMiddle East & North Africa (excluding high income)Middle East & North Africa (IDA & IBRD countries)Middle incomeMoldovaMongoliaMontenegroMoroccoMozambiqueMyanmarNamibiaNepalNetherlandsNew CaledoniaNew ZealandNicaraguaNigerNigeriaNorth AmericaNorwayOECD membersOmanOther small statesPacific island small statesPakistanPalauPanamaPapua New GuineaParaguayPeruPhilippinesPolandPortugalPost-demographic dividendPre-demographic dividendQatarRomaniaRussian FederationRwandaSamoaSao Tome and PrincipeSaudi ArabiaSenegalSerbiaSeychellesSierra LeoneSingaporeSint Maarten (Dutch part)Slovak RepublicSloveniaSmall statesSolomon IslandsSouth AfricaSouth AsiaSouth Asia (IDA & IBRD)South SudanSpainSri LankaSt. Kitts and NevisSt. LuciaSt. Vincent and the GrenadinesSub-Saharan Africa Sub-Saharan Africa (excluding high income)Sub-Saharan Africa (IDA & IBRD countries)SudanSurinameSwazilandSwedenSwitzerlandSyrian Arab RepublicTajikistanTanzaniaThailandTimor-LesteTogoTongaTrinidad and TobagoTunisiaTurkeyTuvaluUgandaUkraineUnited KingdomUnited StatesUpper middle incomeUruguayVanuatuVenezuela, RBWest Bank and GazaWorldYemen, Rep.ZambiaZimbabwe línea de tiempo (timeline):
En esta escala de tiempo se presenta un gráfico de 1978 y 2014 de Antigua and Barbuda. Los datos de 1977 están ausentes. El número de observaciones reales por fecha: 37.
Fuente (nombre):
Indicadores del desarrollo mundial
Fuente (organización):
International Monetary Fund, Balance of Payments Statistics Yearbook and data files.
Categorías:
Private Sector, Trade
Se ha actualizado:
23 abr 2017 año
Los indicadores de los cambios de valor en los últimos años
Mínimo:
16.499
1 ene 1996 año
Máximo:
43.417
1 ene 1985 año
A la fecha de observación
Valor
Cambio absoluto
El cambio con respecto al valor anterior
1 ene 1978 año
32.308
+32.308
0.0%
1 ene 1979 año
34.231
+1.924
5.95%
1 ene 1980 año
32.097
-2.135
-6.24%
1 ene 1981 año
18.144
-13.952
-43.47%
1 ene 1982 año
22.289
+4.145
22.84%
1 ene 1983 año
26.87
+4.581
20.55%
1 ene 1984 año
33.914
+7.044
26.21%
1 ene 1985 año
43.417
+9.503
28.02%
1 ene 1986 año
34.896
-8.521
-19.63%
1 ene 1987 año
17.981
-16.915
-48.47%
1 ene 1988 año
18.925
+0.944
5.25%
1 ene 1989 año
20.491
+1.566
8.27%
1 ene 1990 año
18.551
-1.94
-9.47%
1 ene 1991 año
17.41
-1.141
-6.15%
1 ene 1992 año
19.107
+1.697
9.75%
1 ene 1993 año
18.717
-0.39
-2.04%
1 ene 1994 año
18.953
+0.236
1.26%
1 ene 1995 año
18.847
-0.106
-0.56%
1 ene 1996 año
16.499
-2.348
-12.46%
1 ene 1997 año
17.08
+0.581
3.52%
1 ene 1998 año
16.717
-0.363
-2.12%
1 ene 1999 año
17.488
+0.771
4.61%
1 ene 2000 año
17.761
+0.273
1.56%
1 ene 2001 año
20.948
+3.187
17.95%
1 ene 2002 año
19.781
-1.167
-5.57%
1 ene 2003 año
20.269
+0.489
2.47%
1 ene 2004 año
19.975
-0.295
-1.45%
1 ene 2005 año
20.613
+0.638
3.2%
1 ene 2006 año
18.338
-2.275
-11.04%
1 ene 2007 año
18.185
-0.153
-0.83%
1 ene 2008 año
19.106
+0.921
5.07%
1 ene 2009 año
21.588
+2.482
12.99%
1 ene 2010 año
24.661
+3.073
14.23%
1 ene 2011 año
23.638
-1.023
-4.15%
1 ene 2012 año
24.142
+0.504
2.13%
1 ene 2013 año
24.787
+0.645
2.67%
1 ene 2014 año
23.7
-1.087
-4.39%
Ranking de los países por los datos estadísticos actuales


Comentarios: