29
/pt/
pt
AIzaSyAYiBZKx7MnpbEhh9jyipgxe19OcubqV5w
April 1, 2024
172315
Kuwait
KWT
true
2
1
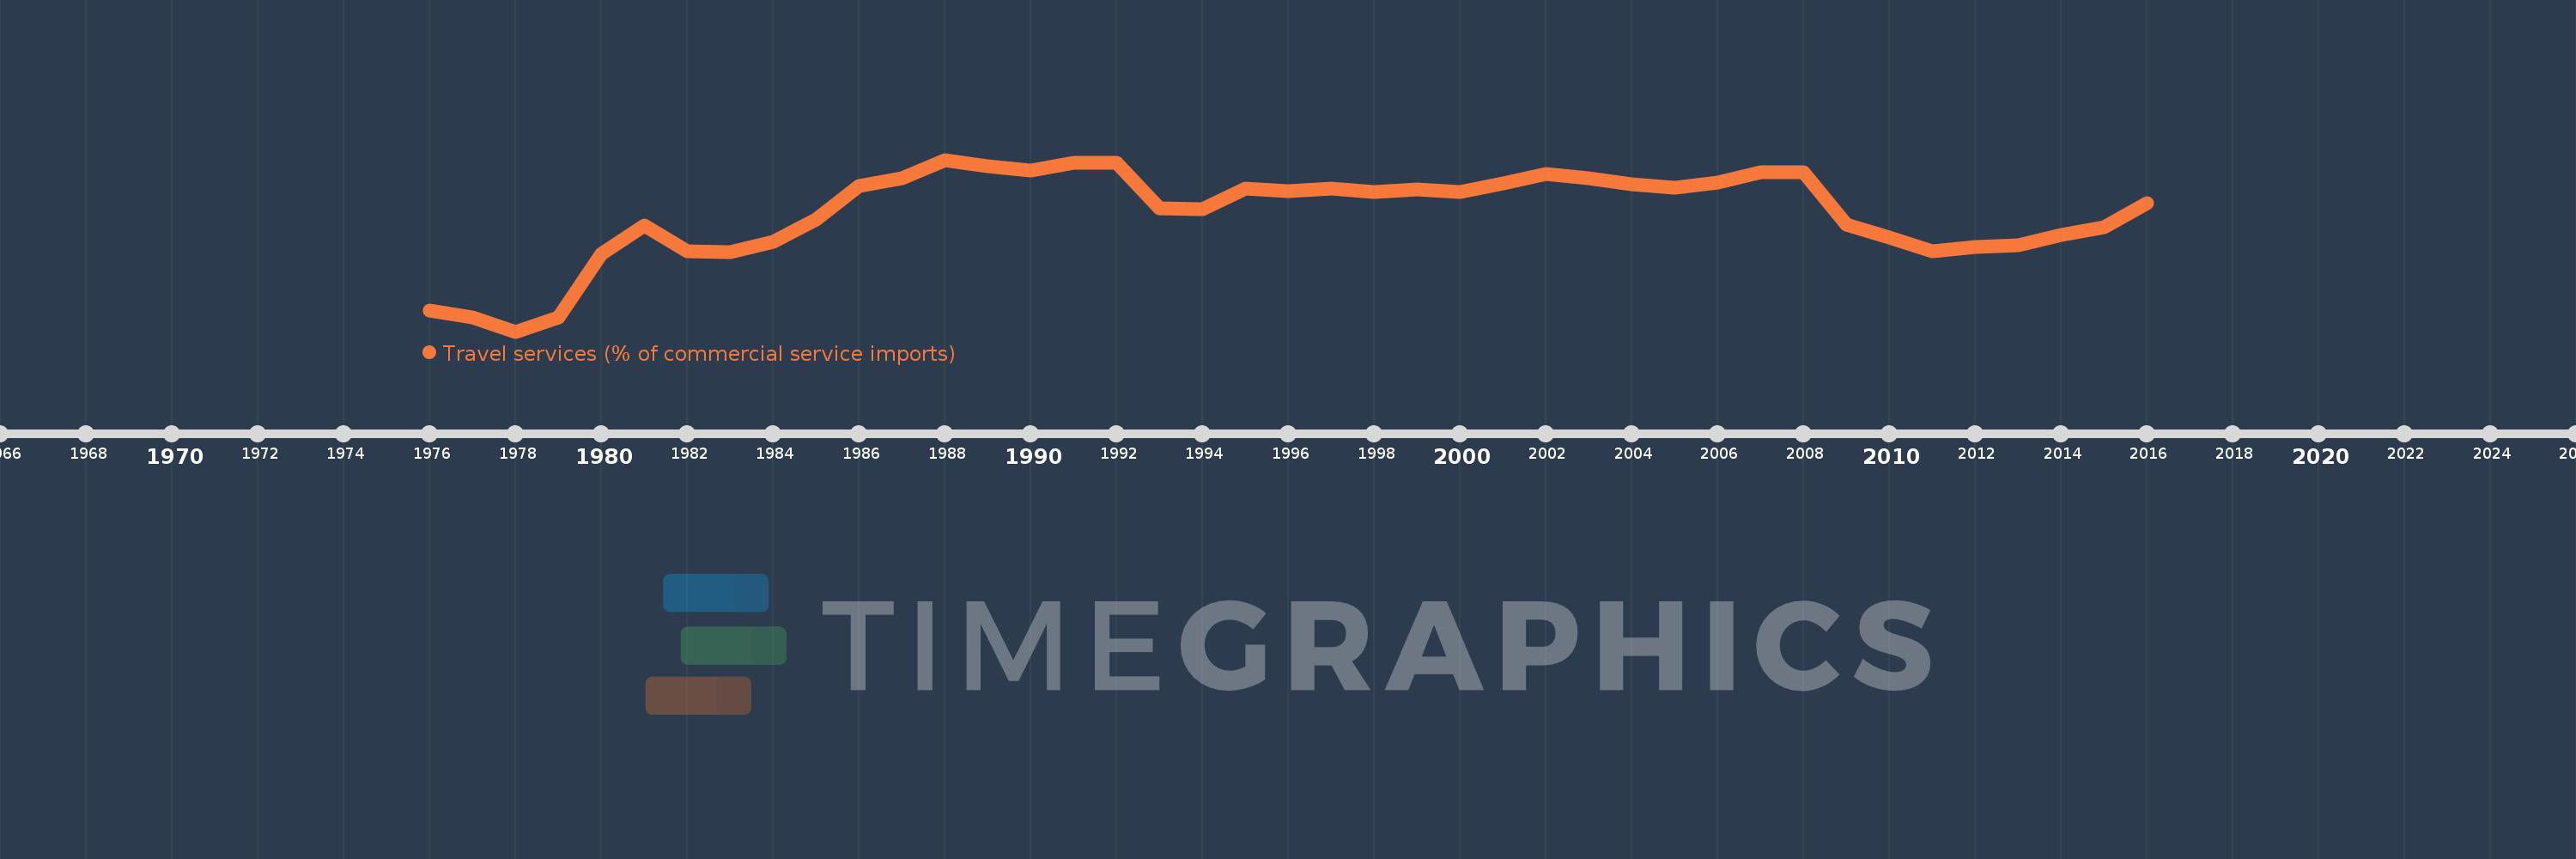
Travel services (% of commercial service imports)
2016,2015,2014,2013,2012,2011,2010,2009,2008,2007,2006,2005,2004,2003,2002,2001,2000,1999,1998,1997,1996,1995,1994,1993,1992,1991,1990,1989,1988,1987,1986,1985,1984,1983,1982,1981,1980,1979,1978,1977,1976
Estas estatísticas em outros países:
AfghanistanAlbaniaAlgeriaAngolaAntigua and BarbudaArab WorldArgentinaArmeniaArubaAustraliaAustriaAzerbaijanBahamas, TheBahrainBangladeshBarbadosBelarusBelgiumBelizeBeninBermudaBhutanBoliviaBosnia and HerzegovinaBotswanaBrazilBrunei DarussalamBulgariaBurkina FasoBurundiCabo VerdeCambodiaCameroonCanadaCaribbean small statesCentral African RepublicCentral Europe and the BalticsChadChileChinaColombiaComorosCongo, Dem. Rep.Congo, Rep.Costa RicaCote d'IvoireCroatiaCuracaoCyprusCzech RepublicDenmarkDjiboutiDominicaDominican RepublicEarly-demographic dividendEast Asia & PacificEast Asia & Pacific (excluding high income)East Asia & Pacific (IDA & IBRD countries)EcuadorEgypt, Arab Rep.El SalvadorEritreaEstoniaEthiopiaEuro areaEurope & Central AsiaEurope & Central Asia (excluding high income)Europe & Central Asia (IDA & IBRD countries)European UnionFaroe IslandsFijiFinlandFragile and conflict affected situationsFranceFrench PolynesiaGabonGambia, TheGeorgiaGermanyGhanaGreeceGrenadaGuatemalaGuineaGuinea-BissauGuyanaHaitiHeavily indebted poor countries (HIPC)High incomeHondurasHong Kong SAR, ChinaHungaryIBRD onlyIcelandIDA & IBRD totalIDA onlyIDA totalIndiaIndonesiaIran, Islamic Rep.IraqIrelandIsraelItalyJamaicaJapanJordanKazakhstanKenyaKiribatiKorea, Rep.KosovoKuwaitKyrgyz RepublicLao PDRLate-demographic dividendLatin America & Caribbean Latin America & Caribbean (excluding high income)Latin America & the Caribbean (IDA & IBRD countries)LatviaLeast developed countries: UN classificationLebanonLesothoLiberiaLibyaLithuaniaLow & middle incomeLow incomeLower middle incomeLuxembourgMacao SAR, ChinaMacedonia, FYRMadagascarMalawiMalaysiaMaldivesMaliMaltaMarshall IslandsMauritaniaMauritiusMexicoMicronesia, Fed. Sts.Middle East & North AfricaMiddle East & North Africa (excluding high income)Middle East & North Africa (IDA & IBRD countries)Middle incomeMoldovaMongoliaMontenegroMoroccoMozambiqueMyanmarNamibiaNepalNetherlandsNew CaledoniaNew ZealandNicaraguaNigerNigeriaNorth AmericaNorwayOECD membersOmanOther small statesPacific island small statesPakistanPalauPanamaPapua New GuineaParaguayPeruPhilippinesPolandPortugalPost-demographic dividendPre-demographic dividendQatarRomaniaRussian FederationRwandaSamoaSao Tome and PrincipeSaudi ArabiaSenegalSerbiaSeychellesSierra LeoneSingaporeSint Maarten (Dutch part)Slovak RepublicSloveniaSmall statesSolomon IslandsSouth AfricaSouth AsiaSouth Asia (IDA & IBRD)South SudanSpainSri LankaSt. Kitts and NevisSt. LuciaSt. Vincent and the GrenadinesSub-Saharan Africa Sub-Saharan Africa (excluding high income)Sub-Saharan Africa (IDA & IBRD countries)SudanSurinameSwazilandSwedenSwitzerlandSyrian Arab RepublicTajikistanTanzaniaThailandTimor-LesteTogoTongaTrinidad and TobagoTunisiaTurkeyTuvaluUgandaUkraineUnited KingdomUnited StatesUpper middle incomeUruguayVanuatuVenezuela, RBWest Bank and GazaWorldYemen, Rep.ZambiaZimbabwe Linha do tempo:
Nesta escala de tempo está apresentado um gráfico de 1976 ano até 2016 ano Kuwait. Dados de 1975 ano ausente. O número de observações reais por data: 41.
Fonte (nome):
Indicadores de desenvolvimento mundial
Fonte (organização):
International Monetary Fund, Balance of Payments Statistics Yearbook and data files.
Categorias:
Private Sector, Trade
Foi atualizado:
23 abr 2017 ano
Indicadores de alterações dos valores ao longo dos anos
Mínimo:
26.19
1 jan 1978 ano
Máximo:
66.141
1 jan 1988 ano
Na data de observação
Valor
Mudança absoluta
A alteração em relação ao valor anterior
1 jan 1976 ano
31.053
+31.053
0.0%
1 jan 1977 ano
29.555
-1.498
-4.82%
1 jan 1978 ano
26.19
-3.364
-11.38%
1 jan 1979 ano
29.444
+3.254
12.42%
1 jan 1980 ano
44.186
+14.742
50.07%
1 jan 1981 ano
50.843
+6.657
15.07%
1 jan 1982 ano
44.802
-6.04
-11.88%
1 jan 1983 ano
44.59
-0.213
-0.47%
1 jan 1984 ano
47.038
+2.448
5.49%
1 jan 1985 ano
52.294
+5.256
11.17%
1 jan 1986 ano
59.98
+7.686
14.7%
1 jan 1987 ano
61.774
+1.794
2.99%
1 jan 1988 ano
66.141
+4.367
7.07%
1 jan 1989 ano
64.637
-1.504
-2.27%
1 jan 1990 ano
63.742
-0.895
-1.38%
1 jan 1991 ano
65.513
+1.771
2.78%
1 jan 1992 ano
65.446
-0.067
-0.1%
1 jan 1993 ano
54.896
-10.55
-16.12%
1 jan 1994 ano
54.736
-0.16
-0.29%
1 jan 1995 ano
59.422
+4.686
8.56%
1 jan 1996 ano
58.767
-0.655
-1.1%
1 jan 1997 ano
59.504
+0.737
1.25%
1 jan 1998 ano
58.618
-0.886
-1.49%
1 jan 1999 ano
59.264
+0.647
1.1%
1 jan 2000 ano
58.694
-0.571
-0.96%
1 jan 2001 ano
60.632
+1.939
3.3%
1 jan 2002 ano
62.884
+2.252
3.71%
1 jan 2003 ano
61.892
-0.993
-1.58%
1 jan 2004 ano
60.496
-1.396
-2.25%
1 jan 2005 ano
59.685
-0.811
-1.34%
1 jan 2006 ano
60.883
+1.199
2.01%
1 jan 2007 ano
63.289
+2.406
3.95%
1 jan 2008 ano
63.237
-0.052
-0.08%
1 jan 2009 ano
51.154
-12.083
-19.11%
1 jan 2010 ano
48.027
-3.127
-6.11%
1 jan 2011 ano
44.919
-3.108
-6.47%
1 jan 2012 ano
45.86
+0.941
2.09%
1 jan 2013 ano
46.213
+0.353
0.77%
1 jan 2014 ano
48.572
+2.359
5.1%
1 jan 2015 ano
50.444
+1.872
3.85%
1 jan 2016 ano
56.069
+5.626
11.15%
Classificação de países por estatísticas atuais por anos


Comentários: