29
/pt/
pt
AIzaSyAYiBZKx7MnpbEhh9jyipgxe19OcubqV5w
April 1, 2024
214899
Norway
NOR
true
2
1
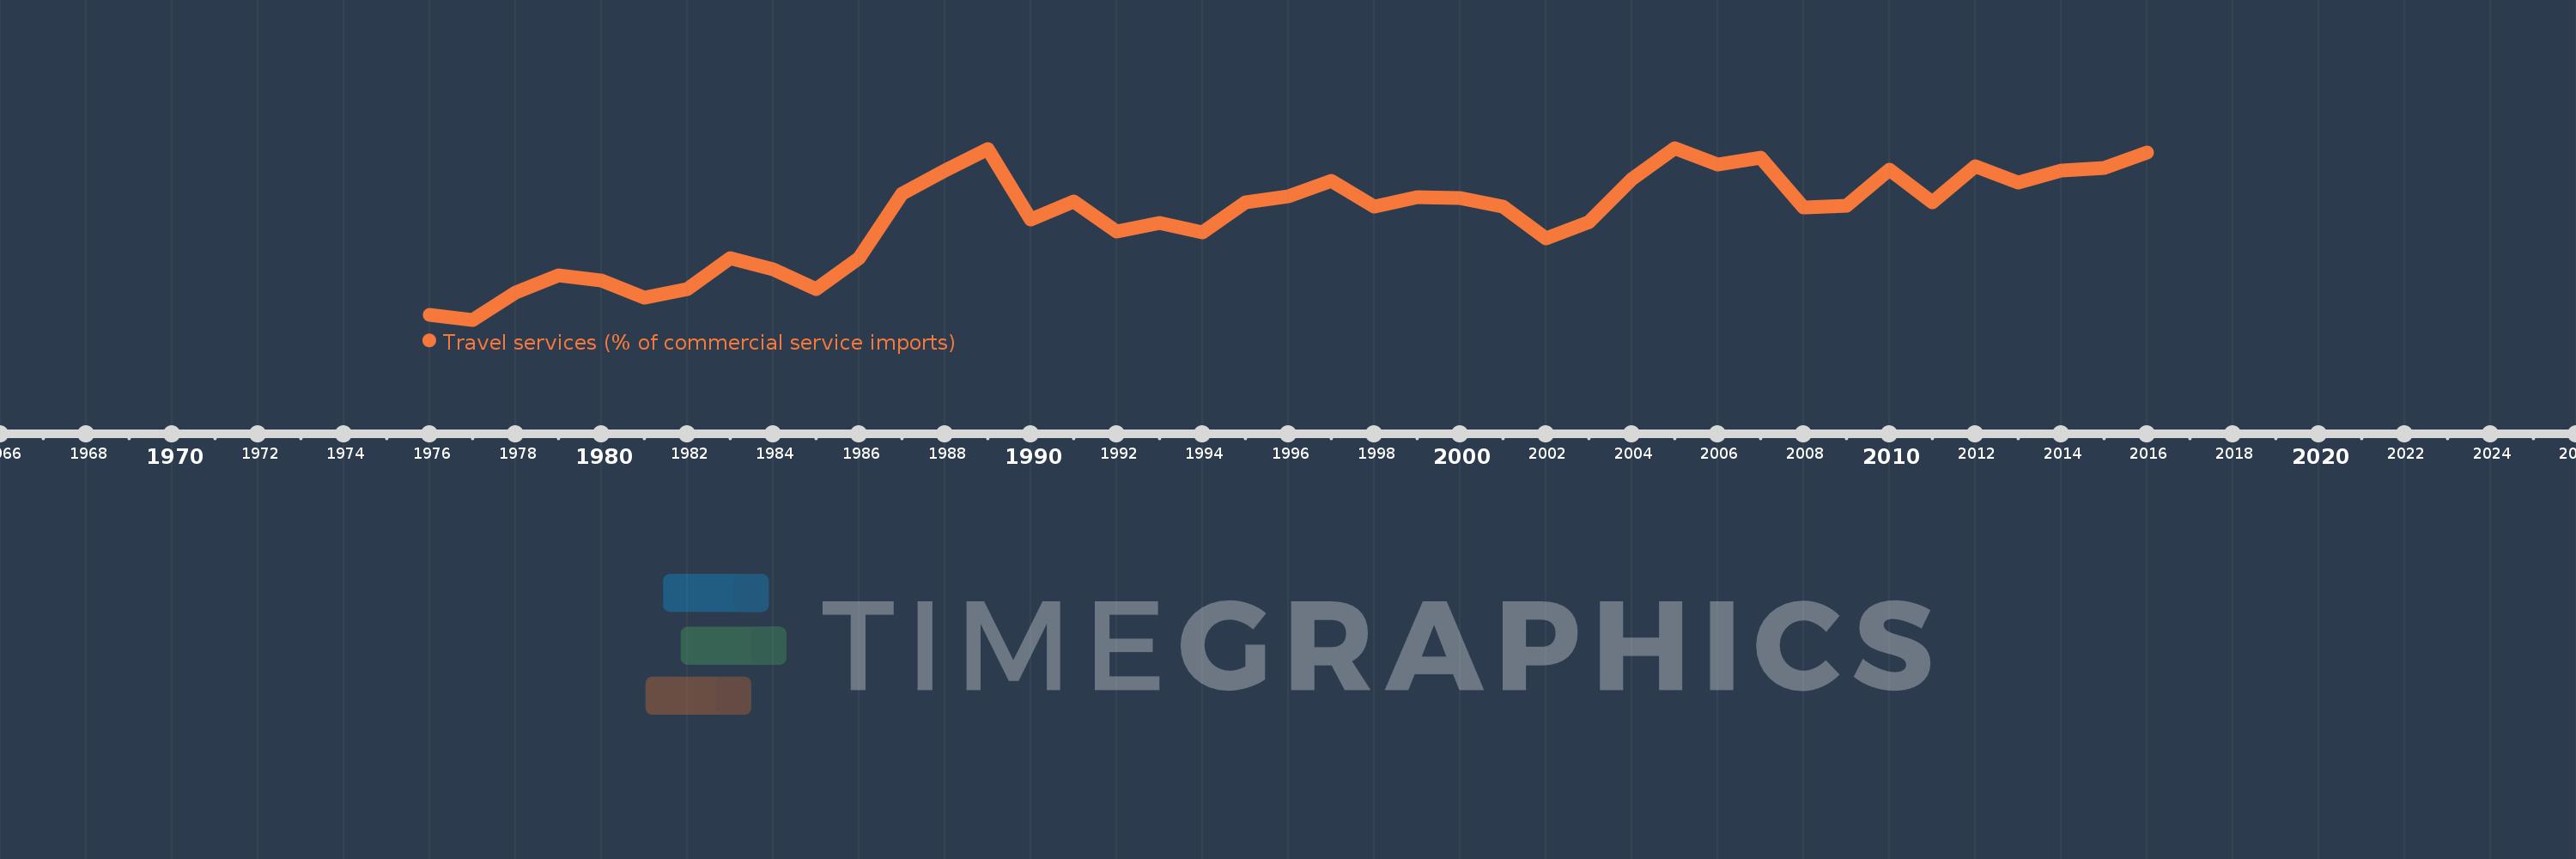
Travel services (% of commercial service imports)
2016,2015,2014,2013,2012,2011,2010,2009,2008,2007,2006,2005,2004,2003,2002,2001,2000,1999,1998,1997,1996,1995,1994,1993,1992,1991,1990,1989,1988,1987,1986,1985,1984,1983,1982,1981,1980,1979,1978,1977,1976
Estas estatísticas em outros países:
AfghanistanAlbaniaAlgeriaAngolaAntigua and BarbudaArab WorldArgentinaArmeniaArubaAustraliaAustriaAzerbaijanBahamas, TheBahrainBangladeshBarbadosBelarusBelgiumBelizeBeninBermudaBhutanBoliviaBosnia and HerzegovinaBotswanaBrazilBrunei DarussalamBulgariaBurkina FasoBurundiCabo VerdeCambodiaCameroonCanadaCaribbean small statesCentral African RepublicCentral Europe and the BalticsChadChileChinaColombiaComorosCongo, Dem. Rep.Congo, Rep.Costa RicaCote d'IvoireCroatiaCuracaoCyprusCzech RepublicDenmarkDjiboutiDominicaDominican RepublicEarly-demographic dividendEast Asia & PacificEast Asia & Pacific (excluding high income)East Asia & Pacific (IDA & IBRD countries)EcuadorEgypt, Arab Rep.El SalvadorEritreaEstoniaEthiopiaEuro areaEurope & Central AsiaEurope & Central Asia (excluding high income)Europe & Central Asia (IDA & IBRD countries)European UnionFaroe IslandsFijiFinlandFragile and conflict affected situationsFranceFrench PolynesiaGabonGambia, TheGeorgiaGermanyGhanaGreeceGrenadaGuatemalaGuineaGuinea-BissauGuyanaHaitiHeavily indebted poor countries (HIPC)High incomeHondurasHong Kong SAR, ChinaHungaryIBRD onlyIcelandIDA & IBRD totalIDA onlyIDA totalIndiaIndonesiaIran, Islamic Rep.IraqIrelandIsraelItalyJamaicaJapanJordanKazakhstanKenyaKiribatiKorea, Rep.KosovoKuwaitKyrgyz RepublicLao PDRLate-demographic dividendLatin America & Caribbean Latin America & Caribbean (excluding high income)Latin America & the Caribbean (IDA & IBRD countries)LatviaLeast developed countries: UN classificationLebanonLesothoLiberiaLibyaLithuaniaLow & middle incomeLow incomeLower middle incomeLuxembourgMacao SAR, ChinaMacedonia, FYRMadagascarMalawiMalaysiaMaldivesMaliMaltaMarshall IslandsMauritaniaMauritiusMexicoMicronesia, Fed. Sts.Middle East & North AfricaMiddle East & North Africa (excluding high income)Middle East & North Africa (IDA & IBRD countries)Middle incomeMoldovaMongoliaMontenegroMoroccoMozambiqueMyanmarNamibiaNepalNetherlandsNew CaledoniaNew ZealandNicaraguaNigerNigeriaNorth AmericaNorwayOECD membersOmanOther small statesPacific island small statesPakistanPalauPanamaPapua New GuineaParaguayPeruPhilippinesPolandPortugalPost-demographic dividendPre-demographic dividendQatarRomaniaRussian FederationRwandaSamoaSao Tome and PrincipeSaudi ArabiaSenegalSerbiaSeychellesSierra LeoneSingaporeSint Maarten (Dutch part)Slovak RepublicSloveniaSmall statesSolomon IslandsSouth AfricaSouth AsiaSouth Asia (IDA & IBRD)South SudanSpainSri LankaSt. Kitts and NevisSt. LuciaSt. Vincent and the GrenadinesSub-Saharan Africa Sub-Saharan Africa (excluding high income)Sub-Saharan Africa (IDA & IBRD countries)SudanSurinameSwazilandSwedenSwitzerlandSyrian Arab RepublicTajikistanTanzaniaThailandTimor-LesteTogoTongaTrinidad and TobagoTunisiaTurkeyTuvaluUgandaUkraineUnited KingdomUnited StatesUpper middle incomeUruguayVanuatuVenezuela, RBWest Bank and GazaWorldYemen, Rep.ZambiaZimbabwe Linha do tempo:
Nesta escala de tempo está apresentado um gráfico de 1976 ano até 2016 ano Norway. Dados de 1975 ano ausente. O número de observações reais por data: 41.
Fonte (nome):
Indicadores de desenvolvimento mundial
Fonte (organização):
International Monetary Fund, Balance of Payments Statistics Yearbook and data files.
Categorias:
Private Sector, Trade
Foi atualizado:
23 abr 2017 ano
Indicadores de alterações dos valores ao longo dos anos
Mínimo:
19.301
1 jan 1977 ano
Máximo:
34.889
1 jan 2005 ano
Na data de observação
Valor
Mudança absoluta
A alteração em relação ao valor anterior
1 jan 1976 ano
19.758
+19.758
0.0%
1 jan 1977 ano
19.301
-0.457
-2.31%
1 jan 1978 ano
21.748
+2.446
12.68%
1 jan 1979 ano
23.343
+1.595
7.33%
1 jan 1980 ano
22.853
-0.49
-2.1%
1 jan 1981 ano
21.269
-1.584
-6.93%
1 jan 1982 ano
22.114
+0.845
3.97%
1 jan 1983 ano
24.87
+2.756
12.46%
1 jan 1984 ano
23.86
-1.01
-4.06%
1 jan 1985 ano
22.078
-1.781
-7.47%
1 jan 1986 ano
24.873
+2.795
12.66%
1 jan 1987 ano
30.753
+5.88
23.64%
1 jan 1988 ano
32.858
+2.105
6.85%
1 jan 1989 ano
34.764
+1.905
5.8%
1 jan 1990 ano
28.389
-6.375
-18.34%
1 jan 1991 ano
30.065
+1.676
5.9%
1 jan 1992 ano
27.286
-2.779
-9.24%
1 jan 1993 ano
28.067
+0.781
2.86%
1 jan 1994 ano
27.191
-0.876
-3.12%
1 jan 1995 ano
29.917
+2.726
10.03%
1 jan 1996 ano
30.537
+0.621
2.07%
1 jan 1997 ano
31.89
+1.353
4.43%
1 jan 1998 ano
29.565
-2.325
-7.29%
1 jan 1999 ano
30.409
+0.844
2.86%
1 jan 2000 ano
30.37
-0.039
-0.13%
1 jan 2001 ano
29.542
-0.828
-2.73%
1 jan 2002 ano
26.687
-2.855
-9.66%
1 jan 2003 ano
28.142
+1.455
5.45%
1 jan 2004 ano
32.09
+3.949
14.03%
1 jan 2005 ano
34.889
+2.798
8.72%
1 jan 2006 ano
33.364
-1.525
-4.37%
1 jan 2007 ano
33.971
+0.608
1.82%
1 jan 2008 ano
29.467
-4.504
-13.26%
1 jan 2009 ano
29.652
+0.185
0.63%
1 jan 2010 ano
32.899
+3.247
10.95%
1 jan 2011 ano
29.971
-2.927
-8.9%
1 jan 2012 ano
33.225
+3.253
10.85%
1 jan 2013 ano
31.728
-1.496
-4.5%
1 jan 2014 ano
32.85
+1.122
3.53%
1 jan 2015 ano
33.082
+0.232
0.7%
1 jan 2016 ano
34.514
+1.433
4.33%
Classificação de países por estatísticas atuais por anos


Comentários: