29
/pt/
pt
AIzaSyAYiBZKx7MnpbEhh9jyipgxe19OcubqV5w
April 1, 2024
90639
Botswana
BWA
true
2
1
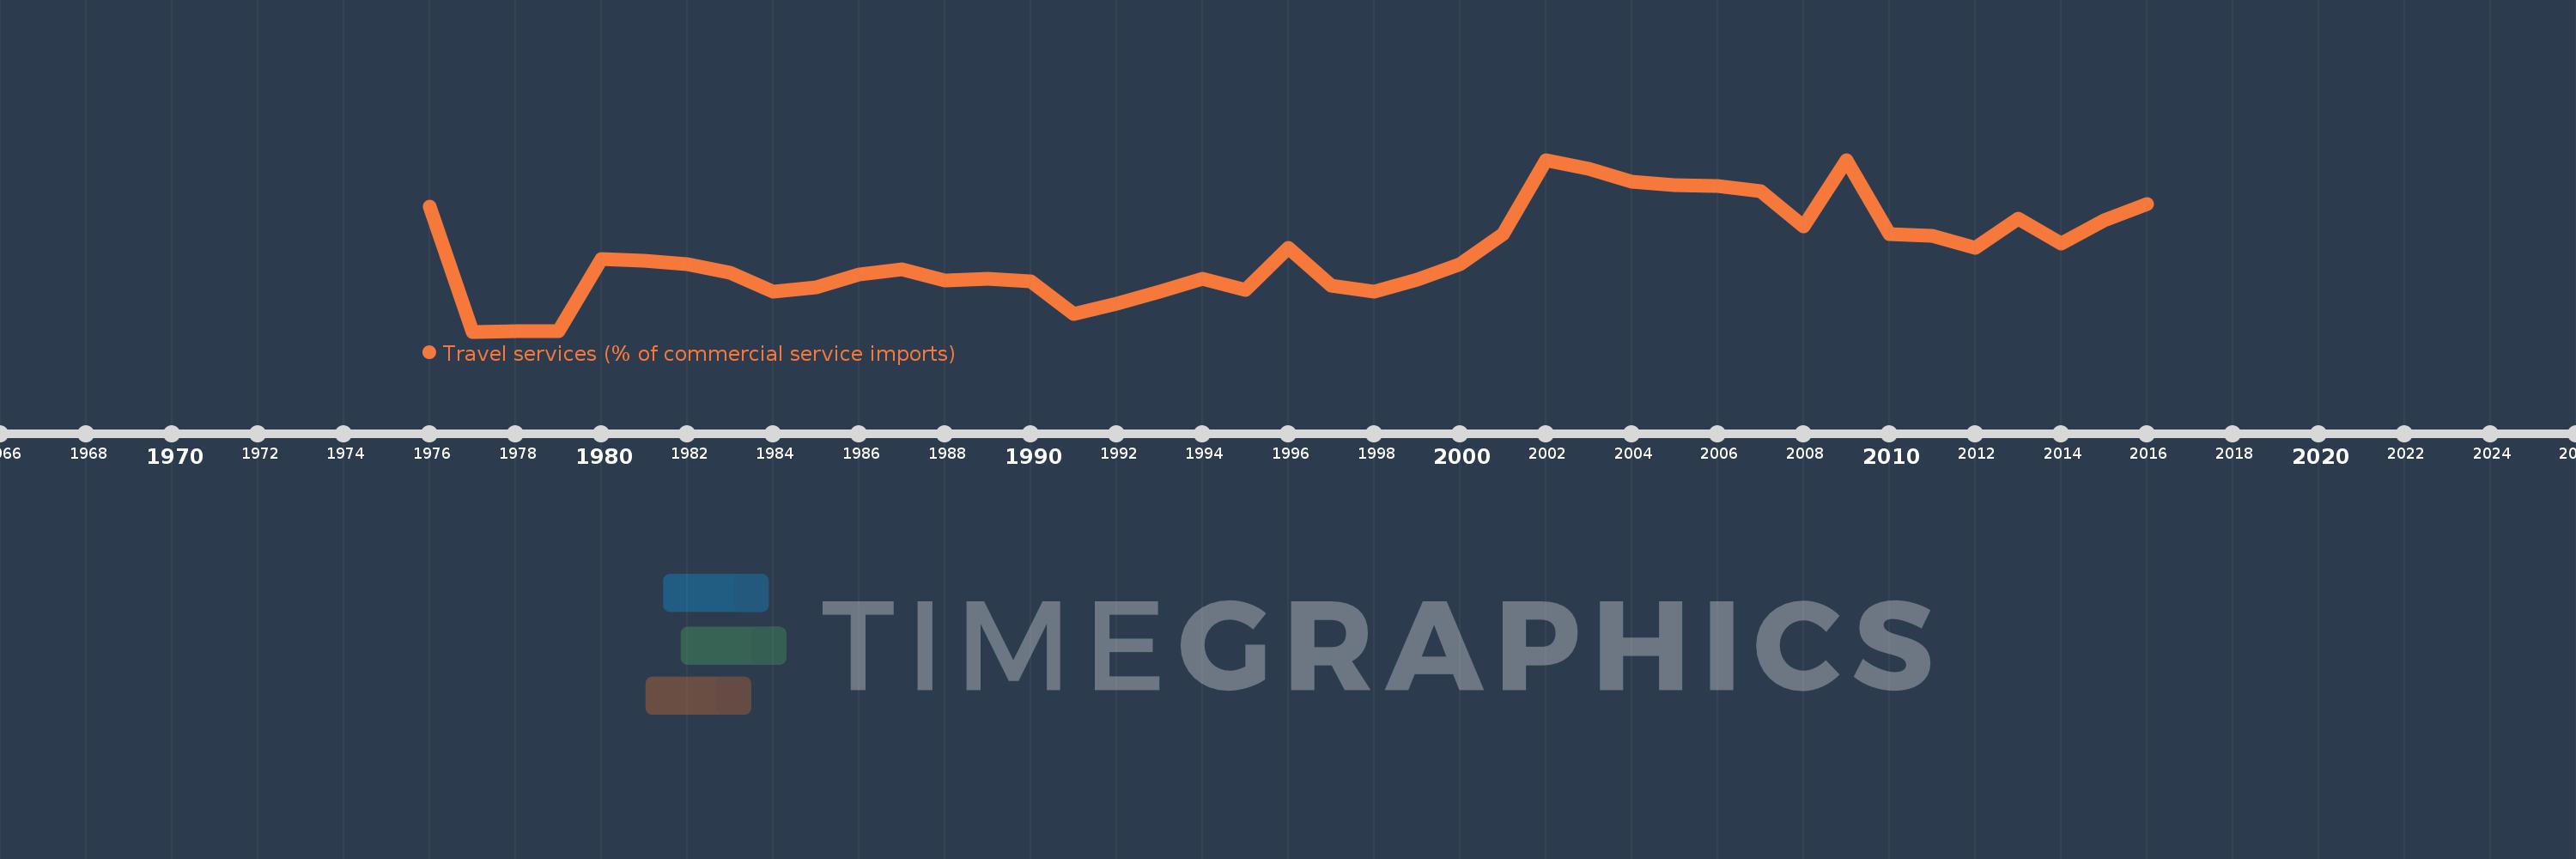
Travel services (% of commercial service imports)
2016,2015,2014,2013,2012,2011,2010,2009,2008,2007,2006,2005,2004,2003,2002,2001,2000,1999,1998,1997,1996,1995,1994,1993,1992,1991,1990,1989,1988,1987,1986,1985,1984,1983,1982,1981,1980,1979,1978,1977,1976
Estas estatísticas em outros países:
AfghanistanAlbaniaAlgeriaAngolaAntigua and BarbudaArab WorldArgentinaArmeniaArubaAustraliaAustriaAzerbaijanBahamas, TheBahrainBangladeshBarbadosBelarusBelgiumBelizeBeninBermudaBhutanBoliviaBosnia and HerzegovinaBotswanaBrazilBrunei DarussalamBulgariaBurkina FasoBurundiCabo VerdeCambodiaCameroonCanadaCaribbean small statesCentral African RepublicCentral Europe and the BalticsChadChileChinaColombiaComorosCongo, Dem. Rep.Congo, Rep.Costa RicaCote d'IvoireCroatiaCuracaoCyprusCzech RepublicDenmarkDjiboutiDominicaDominican RepublicEarly-demographic dividendEast Asia & PacificEast Asia & Pacific (excluding high income)East Asia & Pacific (IDA & IBRD countries)EcuadorEgypt, Arab Rep.El SalvadorEritreaEstoniaEthiopiaEuro areaEurope & Central AsiaEurope & Central Asia (excluding high income)Europe & Central Asia (IDA & IBRD countries)European UnionFaroe IslandsFijiFinlandFragile and conflict affected situationsFranceFrench PolynesiaGabonGambia, TheGeorgiaGermanyGhanaGreeceGrenadaGuatemalaGuineaGuinea-BissauGuyanaHaitiHeavily indebted poor countries (HIPC)High incomeHondurasHong Kong SAR, ChinaHungaryIBRD onlyIcelandIDA & IBRD totalIDA onlyIDA totalIndiaIndonesiaIran, Islamic Rep.IraqIrelandIsraelItalyJamaicaJapanJordanKazakhstanKenyaKiribatiKorea, Rep.KosovoKuwaitKyrgyz RepublicLao PDRLate-demographic dividendLatin America & Caribbean Latin America & Caribbean (excluding high income)Latin America & the Caribbean (IDA & IBRD countries)LatviaLeast developed countries: UN classificationLebanonLesothoLiberiaLibyaLithuaniaLow & middle incomeLow incomeLower middle incomeLuxembourgMacao SAR, ChinaMacedonia, FYRMadagascarMalawiMalaysiaMaldivesMaliMaltaMarshall IslandsMauritaniaMauritiusMexicoMicronesia, Fed. Sts.Middle East & North AfricaMiddle East & North Africa (excluding high income)Middle East & North Africa (IDA & IBRD countries)Middle incomeMoldovaMongoliaMontenegroMoroccoMozambiqueMyanmarNamibiaNepalNetherlandsNew CaledoniaNew ZealandNicaraguaNigerNigeriaNorth AmericaNorwayOECD membersOmanOther small statesPacific island small statesPakistanPalauPanamaPapua New GuineaParaguayPeruPhilippinesPolandPortugalPost-demographic dividendPre-demographic dividendQatarRomaniaRussian FederationRwandaSamoaSao Tome and PrincipeSaudi ArabiaSenegalSerbiaSeychellesSierra LeoneSingaporeSint Maarten (Dutch part)Slovak RepublicSloveniaSmall statesSolomon IslandsSouth AfricaSouth AsiaSouth Asia (IDA & IBRD)South SudanSpainSri LankaSt. Kitts and NevisSt. LuciaSt. Vincent and the GrenadinesSub-Saharan Africa Sub-Saharan Africa (excluding high income)Sub-Saharan Africa (IDA & IBRD countries)SudanSurinameSwazilandSwedenSwitzerlandSyrian Arab RepublicTajikistanTanzaniaThailandTimor-LesteTogoTongaTrinidad and TobagoTunisiaTurkeyTuvaluUgandaUkraineUnited KingdomUnited StatesUpper middle incomeUruguayVanuatuVenezuela, RBWest Bank and GazaWorldYemen, Rep.ZambiaZimbabwe Linha do tempo:
Nesta escala de tempo está apresentado um gráfico de 1976 ano até 2016 ano Botswana. Dados de 1975 ano ausente. O número de observações reais por data: 41.
Fonte (nome):
Indicadores de desenvolvimento mundial
Fonte (organização):
International Monetary Fund, Balance of Payments Statistics Yearbook and data files.
Categorias:
Private Sector, Trade
Foi atualizado:
23 abr 2017 ano
Indicadores de alterações dos valores ao longo dos anos
Mínimo:
10.179
1 jan 1977 ano
Máximo:
56.86
1 jan 2009 ano
Na data de observação
Valor
Mudança absoluta
A alteração em relação ao valor anterior
1 jan 1976 ano
44.128
+44.128
0.0%
1 jan 1977 ano
10.179
-33.95
-76.93%
1 jan 1978 ano
10.273
+0.094
0.93%
1 jan 1979 ano
10.201
-0.072
-0.7%
1 jan 1980 ano
29.888
+19.687
192.99%
1 jan 1981 ano
29.507
-0.381
-1.28%
1 jan 1982 ano
28.407
-1.1
-3.73%
1 jan 1983 ano
26.248
-2.158
-7.6%
1 jan 1984 ano
21.071
-5.178
-19.73%
1 jan 1985 ano
22.232
+1.162
5.51%
1 jan 1986 ano
25.706
+3.474
15.62%
1 jan 1987 ano
27.082
+1.375
5.35%
1 jan 1988 ano
23.999
-3.083
-11.38%
1 jan 1989 ano
24.508
+0.51
2.12%
1 jan 1990 ano
23.781
-0.727
-2.97%
1 jan 1991 ano
14.985
-8.796
-36.99%
1 jan 1992 ano
17.779
+2.794
18.65%
1 jan 1993 ano
20.982
+3.202
18.01%
1 jan 1994 ano
24.468
+3.486
16.61%
1 jan 1995 ano
21.566
-2.901
-11.86%
1 jan 1996 ano
33.003
+11.436
53.03%
1 jan 1997 ano
22.569
-10.434
-31.62%
1 jan 1998 ano
21.062
-1.507
-6.68%
1 jan 1999 ano
24.187
+3.126
14.84%
1 jan 2000 ano
28.511
+4.324
17.88%
1 jan 2001 ano
36.739
+8.228
28.86%
1 jan 2002 ano
56.627
+19.888
54.13%
1 jan 2003 ano
54.411
-2.216
-3.91%
1 jan 2004 ano
51.01
-3.402
-6.25%
1 jan 2005 ano
49.955
-1.055
-2.07%
1 jan 2006 ano
49.756
-0.199
-0.4%
1 jan 2007 ano
48.442
-1.315
-2.64%
1 jan 2008 ano
38.685
-9.757
-20.14%
1 jan 2009 ano
56.86
+18.175
46.98%
1 jan 2010 ano
36.583
-20.277
-35.66%
1 jan 2011 ano
36.105
-0.478
-1.31%
1 jan 2012 ano
32.951
-3.154
-8.74%
1 jan 2013 ano
40.847
+7.896
23.96%
1 jan 2014 ano
34.049
-6.798
-16.64%
1 jan 2015 ano
40.468
+6.419
18.85%
1 jan 2016 ano
44.831
+4.363
10.78%
Classificação de países por estatísticas atuais por anos


Comentários: