29
/es/
es
AIzaSyAYiBZKx7MnpbEhh9jyipgxe19OcubqV5w
April 1, 2024
126699
El Salvador
SLV
true
2
1
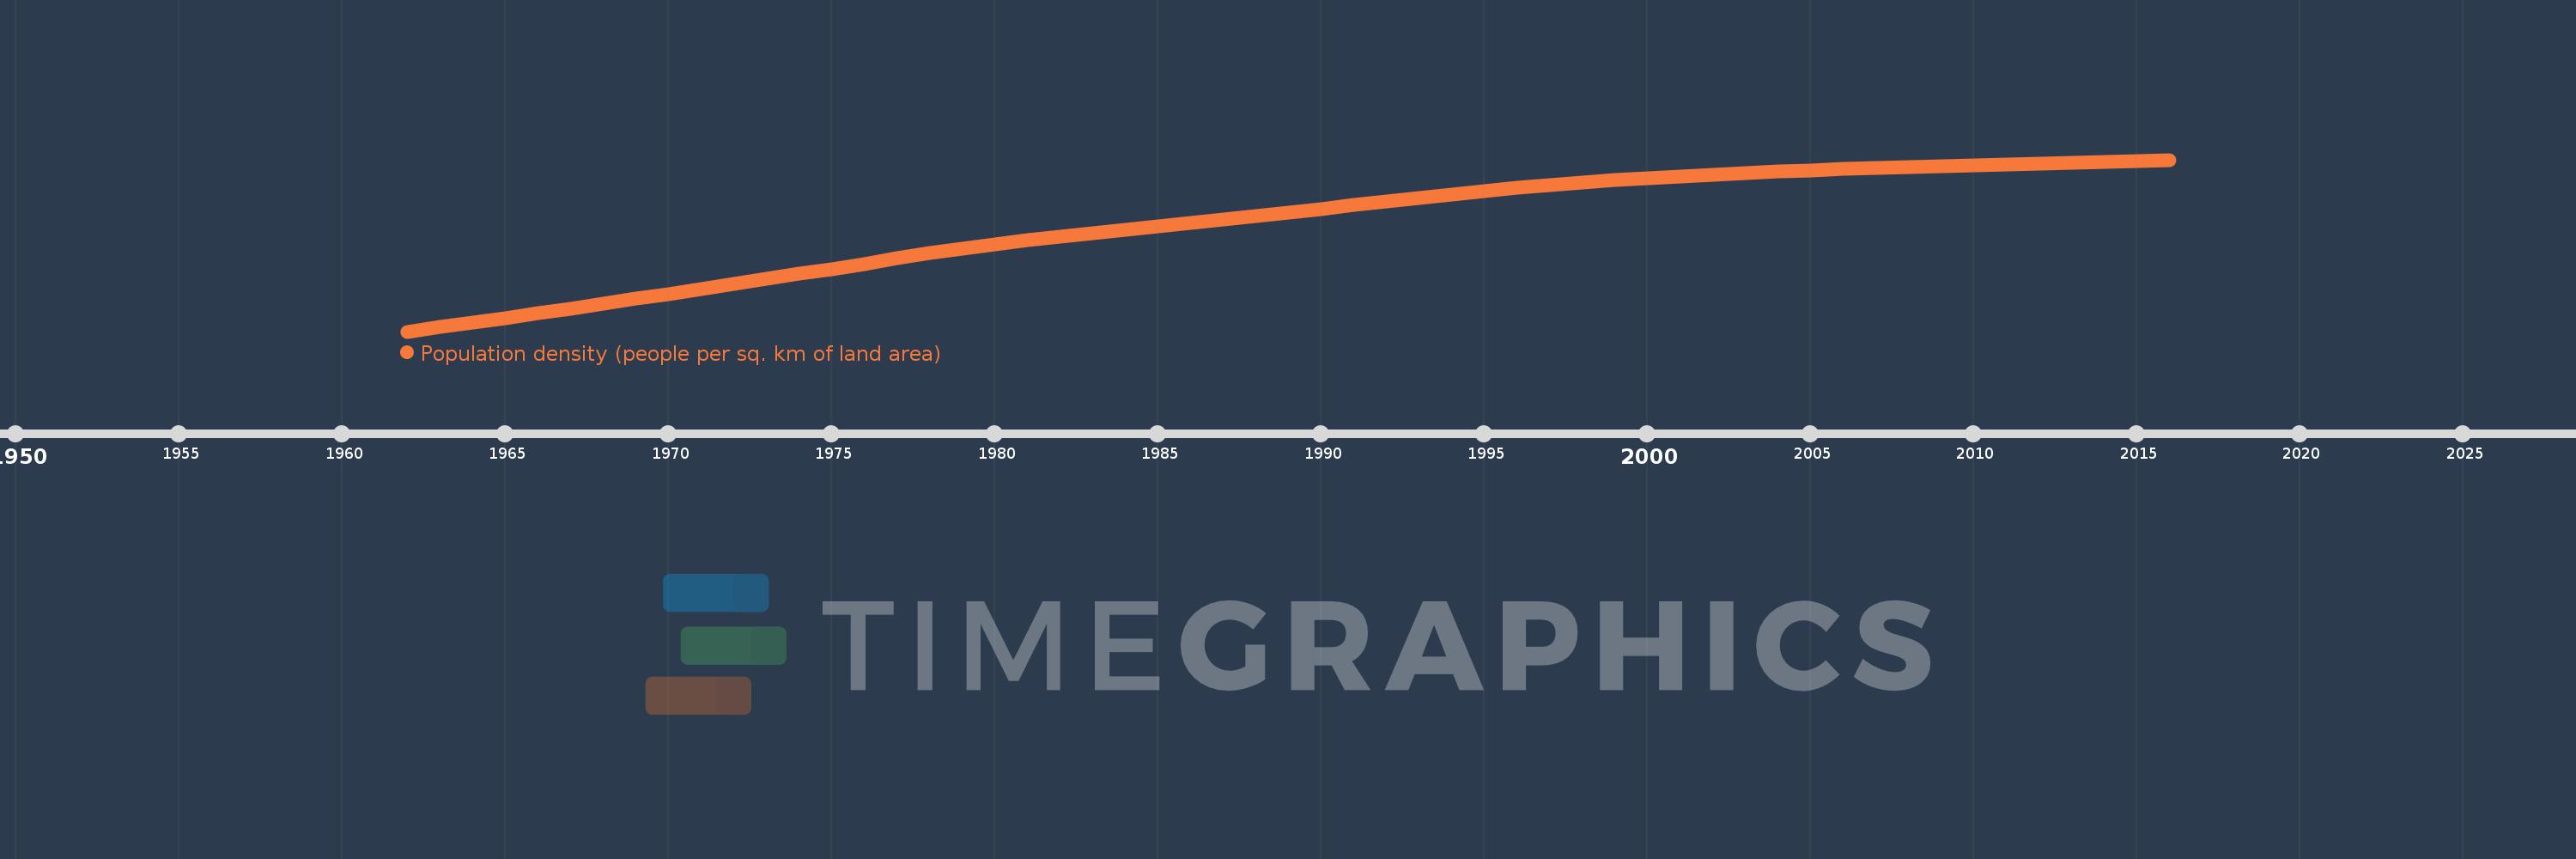
Population density (people per sq. km of land area)
2016,2015,2014,2013,2012,2011,2010,2009,2008,2007,2006,2005,2004,2003,2002,2001,2000,1999,1998,1997,1996,1995,1994,1993,1992,1991,1990,1989,1988,1987,1986,1985,1984,1983,1982,1981,1980,1979,1978,1977,1976,1975,1974,1973,1972,1971,1970,1969,1968,1967,1966,1965,1964,1963,1962
Estas estadísticas en otros países:
AfghanistanAlbaniaAlgeriaAmerican SamoaAndorraAngolaAntigua and BarbudaArab WorldArgentinaArmeniaArubaAustraliaAustriaAzerbaijanBahamas, TheBahrainBangladeshBarbadosBelarusBelgiumBelizeBeninBermudaBhutanBoliviaBosnia and HerzegovinaBotswanaBrazilBritish Virgin IslandsBrunei DarussalamBulgariaBurkina FasoBurundiCabo VerdeCambodiaCameroonCanadaCaribbean small statesCayman IslandsCentral African RepublicCentral Europe and the BalticsChadChannel IslandsChileChinaColombiaComorosCongo, Dem. Rep.Congo, Rep.Costa RicaCote d'IvoireCroatiaCubaCuracaoCyprusCzech RepublicDenmarkDjiboutiDominicaDominican RepublicEarly-demographic dividendEast Asia & PacificEast Asia & Pacific (excluding high income)East Asia & Pacific (IDA & IBRD countries)EcuadorEgypt, Arab Rep.El SalvadorEquatorial GuineaEritreaEstoniaEthiopiaEuro areaEurope & Central AsiaEurope & Central Asia (excluding high income)Europe & Central Asia (IDA & IBRD countries)European UnionFaroe IslandsFijiFinlandFragile and conflict affected situationsFranceFrench PolynesiaGabonGambia, TheGeorgiaGermanyGhanaGibraltarGreeceGreenlandGrenadaGuamGuatemalaGuineaGuinea-BissauGuyanaHaitiHeavily indebted poor countries (HIPC)High incomeHondurasHong Kong SAR, ChinaHungaryIBRD onlyIcelandIDA & IBRD totalIDA blendIDA onlyIDA totalIndiaIndonesiaIran, Islamic Rep.IraqIrelandIsle of ManIsraelItalyJamaicaJapanJordanKazakhstanKenyaKiribatiKorea, Dem. People’s Rep.Korea, Rep.KosovoKuwaitKyrgyz RepublicLao PDRLate-demographic dividendLatin America & Caribbean Latin America & Caribbean (excluding high income)Latin America & the Caribbean (IDA & IBRD countries)LatviaLeast developed countries: UN classificationLebanonLesothoLiberiaLibyaLiechtensteinLithuaniaLow & middle incomeLow incomeLower middle incomeLuxembourgMacao SAR, ChinaMacedonia, FYRMadagascarMalawiMalaysiaMaldivesMaliMaltaMarshall IslandsMauritaniaMauritiusMexicoMicronesia, Fed. Sts.Middle East & North AfricaMiddle East & North Africa (excluding high income)Middle East & North Africa (IDA & IBRD countries)Middle incomeMoldovaMonacoMongoliaMontenegroMoroccoMozambiqueMyanmarNamibiaNauruNepalNetherlandsNew CaledoniaNew ZealandNicaraguaNigerNigeriaNorth AmericaNorthern Mariana IslandsNorwayOECD membersOmanOther small statesPacific island small statesPakistanPalauPanamaPapua New GuineaParaguayPeruPhilippinesPolandPortugalPost-demographic dividendPre-demographic dividendPuerto RicoQatarRomaniaRussian FederationRwandaSamoaSan MarinoSao Tome and PrincipeSaudi ArabiaSenegalSerbiaSeychellesSierra LeoneSingaporeSint Maarten (Dutch part)Slovak RepublicSloveniaSmall statesSolomon IslandsSomaliaSouth AfricaSouth AsiaSouth Asia (IDA & IBRD)SpainSri LankaSt. Kitts and NevisSt. LuciaSt. Martin (French part)St. Vincent and the GrenadinesSub-Saharan Africa Sub-Saharan Africa (excluding high income)Sub-Saharan Africa (IDA & IBRD countries)SudanSurinameSwazilandSwedenSwitzerlandSyrian Arab RepublicTajikistanTanzaniaThailandTimor-LesteTogoTongaTrinidad and TobagoTunisiaTurkeyTurkmenistanTurks and Caicos IslandsTuvaluUgandaUkraineUnited Arab EmiratesUnited KingdomUnited StatesUpper middle incomeUruguayUzbekistanVanuatuVenezuela, RBVietnamVirgin Islands (U.S.)West Bank and GazaWorldYemen, Rep.ZambiaZimbabwe línea de tiempo (timeline):
En esta escala de tiempo se presenta un gráfico de 1962 y 2016 de El Salvador. Los datos de 1961 están ausentes. El número de observaciones reales por fecha: 55.
Fuente (nombre):
Indicadores del desarrollo mundial
Fuente (organización):
Food and Agriculture Organization and World Bank population estimates.
Categorías:
Urban Development
Se ha actualizado:
23 abr 2017 año
Los indicadores de los cambios de valor en los últimos años
Mínimo:
136.367
1 ene 1962 año
Máximo:
295.685
1 ene 2016 año
A la fecha de observación
Valor
Cambio absoluto
El cambio con respecto al valor anterior
1 ene 1962 año
136.367
+136.367
0.0%
1 ene 1963 año
140.425
+4.058
2.98%
1 ene 1964 año
144.647
+4.222
3.01%
1 ene 1965 año
148.978
+4.331
2.99%
1 ene 1966 año
153.375
+4.397
2.95%
1 ene 1967 año
157.813
+4.438
2.89%
1 ene 1968 año
162.287
+4.474
2.83%
1 ene 1969 año
166.796
+4.51
2.78%
1 ene 1970 año
171.351
+4.555
2.73%
1 ene 1971 año
175.952
+4.601
2.68%
1 ene 1972 año
180.588
+4.636
2.63%
1 ene 1973 año
185.234
+4.647
2.57%
1 ene 1974 año
189.862
+4.628
2.5%
1 ene 1975 año
194.434
+4.573
2.41%
1 ene 1976 año
198.922
+4.488
2.31%
1 ene 1977 año
204.595
+5.673
2.85%
1 ene 1978 año
208.92
+4.325
2.11%
1 ene 1979 año
213.109
+4.19
2.01%
1 ene 1980 año
217.121
+4.012
1.88%
1 ene 1981 año
220.931
+3.809
1.75%
1 ene 1982 año
224.52
+3.59
1.62%
1 ene 1983 año
227.909
+3.389
1.51%
1 ene 1984 año
231.152
+3.243
1.42%
1 ene 1985 año
234.328
+3.176
1.37%
1 ene 1986 año
237.497
+3.169
1.35%
1 ene 1987 año
240.663
+3.166
1.33%
1 ene 1988 año
243.817
+3.154
1.31%
1 ene 1989 año
246.987
+3.17
1.3%
1 ene 1990 año
250.204
+3.216
1.3%
1 ene 1991 año
253.479
+3.275
1.31%
1 ene 1992 año
256.833
+3.354
1.32%
1 ene 1993 año
260.239
+3.406
1.33%
1 ene 1994 año
263.602
+3.364
1.29%
1 ene 1995 año
266.796
+3.194
1.21%
1 ene 1996 año
269.727
+2.931
1.1%
1 ene 1997 año
272.363
+2.636
0.98%
1 ene 1998 año
274.725
+2.362
0.87%
1 ene 1999 año
276.838
+2.113
0.77%
1 ene 2000 año
278.748
+1.91
0.69%
1 ene 2001 año
280.494
+1.746
0.63%
1 ene 2002 año
282.082
+1.588
0.57%
1 ene 2003 año
283.509
+1.427
0.51%
1 ene 2004 año
284.794
+1.285
0.45%
1 ene 2005 año
285.96
+1.166
0.41%
1 ene 2006 año
287.027
+1.067
0.37%
1 ene 2007 año
288.009
+0.982
0.34%
1 ene 2008 año
288.92
+0.91
0.32%
1 ene 2009 año
289.778
+0.858
0.3%
1 ene 2010 año
290.607
+0.829
0.29%
1 ene 2011 año
291.424
+0.817
0.28%
1 ene 2012 año
292.24
+0.816
0.28%
1 ene 2013 año
293.061
+0.822
0.28%
1 ene 2014 año
293.902
+0.84
0.29%
1 ene 2015 año
294.773
+0.872
0.3%
1 ene 2016 año
295.685
+0.911
0.31%
Ranking de los países por los datos estadísticos actuales


Comentarios: