29
/es/
es
AIzaSyAYiBZKx7MnpbEhh9jyipgxe19OcubqV5w
April 1, 2024
249238
Sri Lanka
LKA
true
2
1
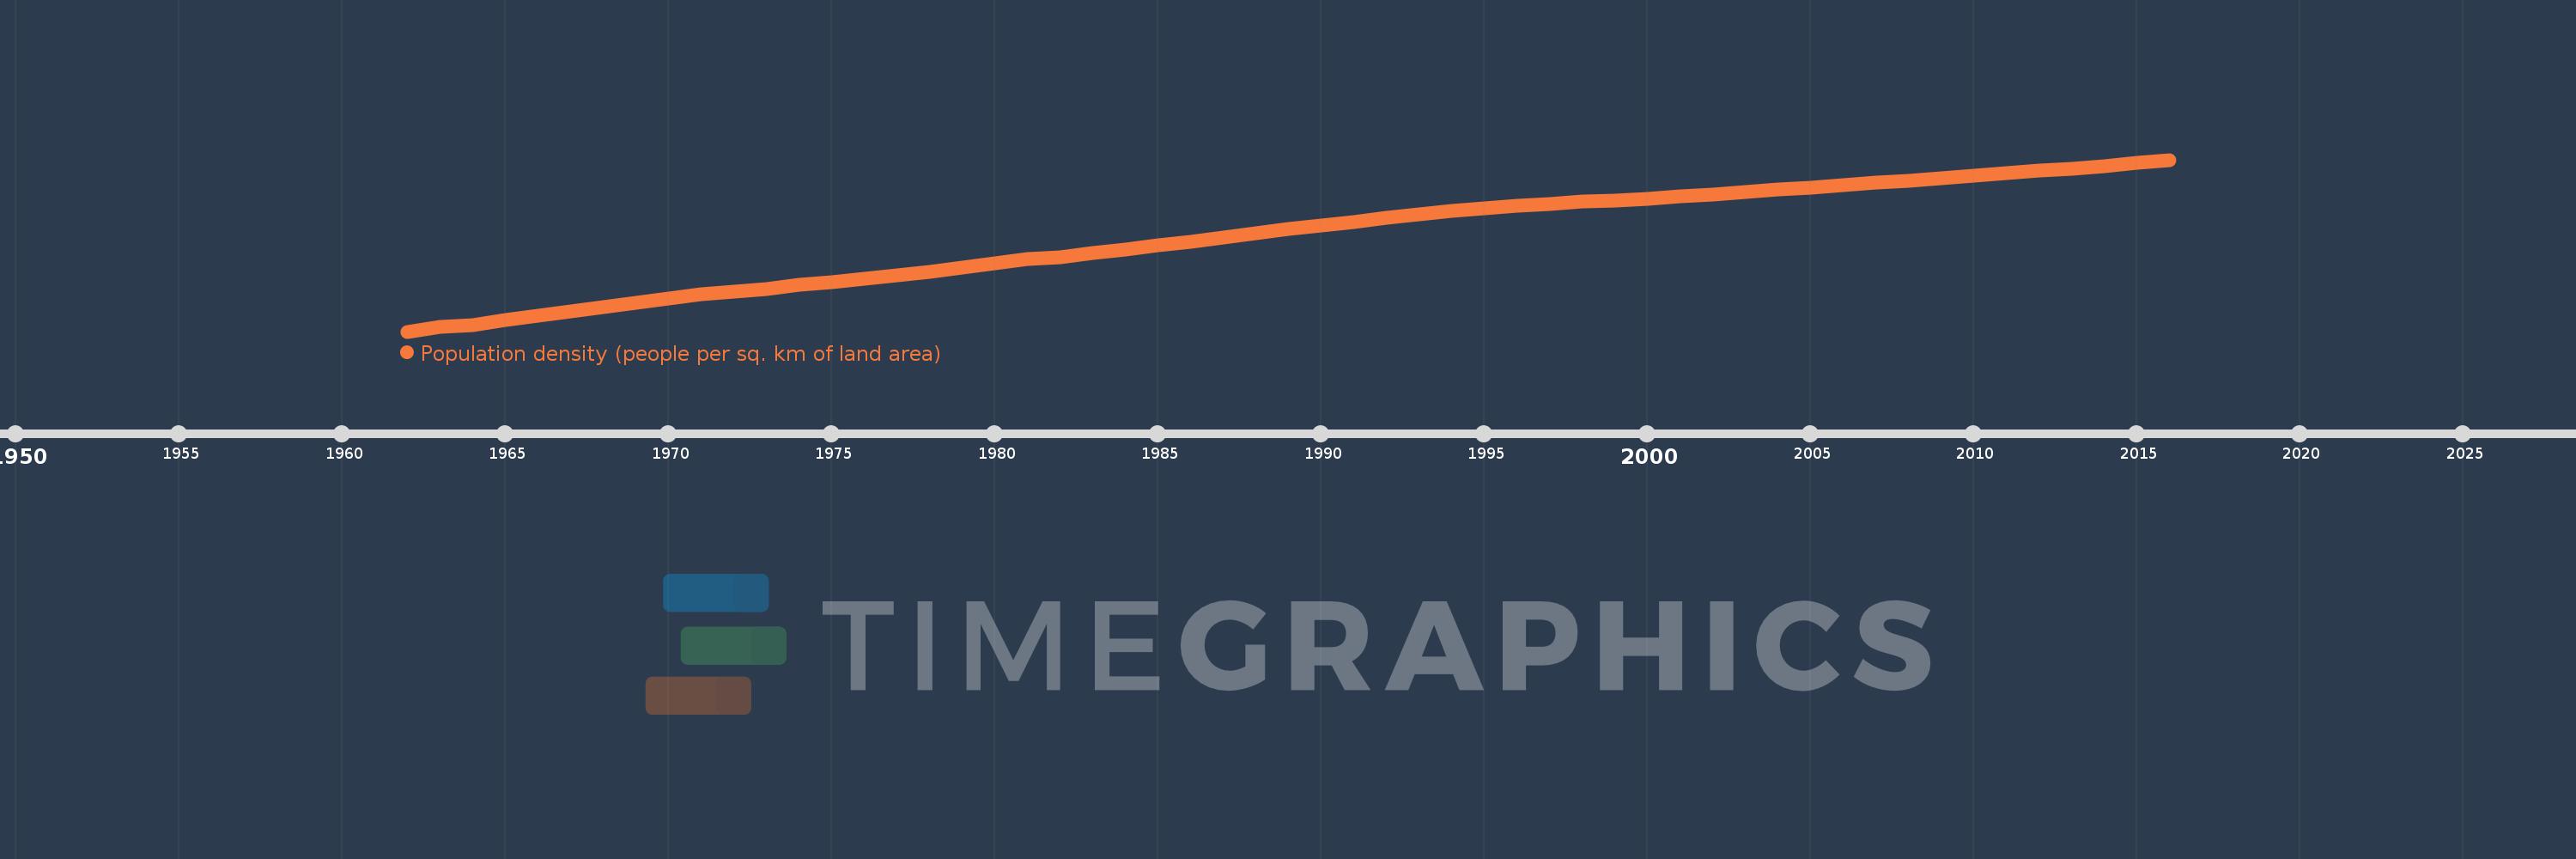
Population density (people per sq. km of land area)
2016,2015,2014,2013,2012,2011,2010,2009,2008,2007,2006,2005,2004,2003,2002,2001,2000,1999,1998,1997,1996,1995,1994,1993,1992,1991,1990,1989,1988,1987,1986,1985,1984,1983,1982,1981,1980,1979,1978,1977,1976,1975,1974,1973,1972,1971,1970,1969,1968,1967,1966,1965,1964,1963,1962
Estas estadísticas en otros países:
AfghanistanAlbaniaAlgeriaAmerican SamoaAndorraAngolaAntigua and BarbudaArab WorldArgentinaArmeniaArubaAustraliaAustriaAzerbaijanBahamas, TheBahrainBangladeshBarbadosBelarusBelgiumBelizeBeninBermudaBhutanBoliviaBosnia and HerzegovinaBotswanaBrazilBritish Virgin IslandsBrunei DarussalamBulgariaBurkina FasoBurundiCabo VerdeCambodiaCameroonCanadaCaribbean small statesCayman IslandsCentral African RepublicCentral Europe and the BalticsChadChannel IslandsChileChinaColombiaComorosCongo, Dem. Rep.Congo, Rep.Costa RicaCote d'IvoireCroatiaCubaCuracaoCyprusCzech RepublicDenmarkDjiboutiDominicaDominican RepublicEarly-demographic dividendEast Asia & PacificEast Asia & Pacific (excluding high income)East Asia & Pacific (IDA & IBRD countries)EcuadorEgypt, Arab Rep.El SalvadorEquatorial GuineaEritreaEstoniaEthiopiaEuro areaEurope & Central AsiaEurope & Central Asia (excluding high income)Europe & Central Asia (IDA & IBRD countries)European UnionFaroe IslandsFijiFinlandFragile and conflict affected situationsFranceFrench PolynesiaGabonGambia, TheGeorgiaGermanyGhanaGibraltarGreeceGreenlandGrenadaGuamGuatemalaGuineaGuinea-BissauGuyanaHaitiHeavily indebted poor countries (HIPC)High incomeHondurasHong Kong SAR, ChinaHungaryIBRD onlyIcelandIDA & IBRD totalIDA blendIDA onlyIDA totalIndiaIndonesiaIran, Islamic Rep.IraqIrelandIsle of ManIsraelItalyJamaicaJapanJordanKazakhstanKenyaKiribatiKorea, Dem. People’s Rep.Korea, Rep.KosovoKuwaitKyrgyz RepublicLao PDRLate-demographic dividendLatin America & Caribbean Latin America & Caribbean (excluding high income)Latin America & the Caribbean (IDA & IBRD countries)LatviaLeast developed countries: UN classificationLebanonLesothoLiberiaLibyaLiechtensteinLithuaniaLow & middle incomeLow incomeLower middle incomeLuxembourgMacao SAR, ChinaMacedonia, FYRMadagascarMalawiMalaysiaMaldivesMaliMaltaMarshall IslandsMauritaniaMauritiusMexicoMicronesia, Fed. Sts.Middle East & North AfricaMiddle East & North Africa (excluding high income)Middle East & North Africa (IDA & IBRD countries)Middle incomeMoldovaMonacoMongoliaMontenegroMoroccoMozambiqueMyanmarNamibiaNauruNepalNetherlandsNew CaledoniaNew ZealandNicaraguaNigerNigeriaNorth AmericaNorthern Mariana IslandsNorwayOECD membersOmanOther small statesPacific island small statesPakistanPalauPanamaPapua New GuineaParaguayPeruPhilippinesPolandPortugalPost-demographic dividendPre-demographic dividendPuerto RicoQatarRomaniaRussian FederationRwandaSamoaSan MarinoSao Tome and PrincipeSaudi ArabiaSenegalSerbiaSeychellesSierra LeoneSingaporeSint Maarten (Dutch part)Slovak RepublicSloveniaSmall statesSolomon IslandsSomaliaSouth AfricaSouth AsiaSouth Asia (IDA & IBRD)SpainSri LankaSt. Kitts and NevisSt. LuciaSt. Martin (French part)St. Vincent and the GrenadinesSub-Saharan Africa Sub-Saharan Africa (excluding high income)Sub-Saharan Africa (IDA & IBRD countries)SudanSurinameSwazilandSwedenSwitzerlandSyrian Arab RepublicTajikistanTanzaniaThailandTimor-LesteTogoTongaTrinidad and TobagoTunisiaTurkeyTurkmenistanTurks and Caicos IslandsTuvaluUgandaUkraineUnited Arab EmiratesUnited KingdomUnited StatesUpper middle incomeUruguayUzbekistanVanuatuVenezuela, RBVietnamVirgin Islands (U.S.)West Bank and GazaWorldYemen, Rep.ZambiaZimbabwe línea de tiempo (timeline):
En esta escala de tiempo se presenta un gráfico de 1962 y 2016 de Sri Lanka. Los datos de 1961 están ausentes. El número de observaciones reales por fecha: 55.
Fuente (nombre):
Indicadores del desarrollo mundial
Fuente (organización):
Food and Agriculture Organization and World Bank population estimates.
Categorías:
Urban Development
Se ha actualizado:
23 abr 2017 año
Los indicadores de los cambios de valor en los últimos años
Mínimo:
162.143
1 ene 1962 año
Máximo:
334.333
1 ene 2016 año
A la fecha de observación
Valor
Cambio absoluto
El cambio con respecto al valor anterior
1 ene 1962 año
162.143
+162.143
0.0%
1 ene 1963 año
166.528
+4.385
2.7%
1 ene 1964 año
168.745
+2.217
1.33%
1 ene 1965 año
173.864
+5.119
3.03%
1 ene 1966 año
178.026
+4.162
2.39%
1 ene 1967 año
182.411
+4.385
2.46%
1 ene 1968 año
186.621
+4.21
2.31%
1 ene 1969 año
191.229
+4.609
2.47%
1 ene 1970 año
195.376
+4.146
2.17%
1 ene 1971 año
199.554
+4.178
2.14%
1 ene 1972 año
202.36
+2.807
1.41%
1 ene 1973 año
205.087
+2.727
1.35%
1 ene 1974 año
208.755
+3.668
1.79%
1 ene 1975 año
211.832
+3.078
1.47%
1 ene 1976 año
215.213
+3.381
1.6%
1 ene 1977 año
218.737
+3.524
1.64%
1 ene 1978 año
222.325
+3.588
1.64%
1 ene 1979 año
226.28
+3.955
1.78%
1 ene 1980 año
230.777
+4.497
1.99%
1 ene 1981 año
235.162
+4.385
1.9%
1 ene 1982 año
236.756
+1.595
0.68%
1 ene 1983 año
240.727
+3.971
1.68%
1 ene 1984 año
244.602
+3.875
1.61%
1 ene 1985 año
248.493
+3.891
1.59%
1 ene 1986 año
252.448
+3.955
1.59%
1 ene 1987 año
256.466
+4.018
1.59%
1 ene 1988 año
260.549
+4.082
1.59%
1 ene 1989 año
264.599
+4.05
1.55%
1 ene 1990 año
268.554
+3.955
1.49%
1 ene 1991 año
272.333
+3.779
1.41%
1 ene 1992 año
275.969
+3.636
1.34%
1 ene 1993 año
279.445
+3.476
1.26%
1 ene 1994 año
282.698
+3.253
1.16%
1 ene 1995 año
285.632
+2.934
1.04%
1 ene 1996 año
288.216
+2.583
0.9%
1 ene 1997 año
290.384
+2.169
0.75%
1 ene 1998 año
292.186
+1.802
0.62%
1 ene 1999 año
293.813
+1.627
0.56%
1 ene 2000 año
295.519
+1.706
0.58%
1 ene 2001 año
297.48
+1.961
0.66%
1 ene 2002 año
299.745
+2.264
0.76%
1 ene 2003 año
302.009
+2.264
0.76%
1 ene 2004 año
304.306
+2.296
0.76%
1 ene 2005 año
306.618
+2.312
0.76%
1 ene 2006 año
308.93
+2.312
0.75%
1 ene 2007 año
311.274
+2.344
0.76%
1 ene 2008 año
313.634
+2.36
0.76%
1 ene 2009 año
316.01
+2.376
0.76%
1 ene 2010 año
318.418
+2.408
0.76%
1 ene 2011 año
320.826
+2.408
0.76%
1 ene 2012 año
323.25
+2.424
0.76%
1 ene 2013 año
325.706
+2.456
0.76%
1 ene 2014 año
328.257
+2.551
0.78%
1 ene 2015 año
331.223
+2.966
0.9%
1 ene 2016 año
334.333
+3.11
0.94%
Ranking de los países por los datos estadísticos actuales


Comentarios: