29
/es/
es
AIzaSyAYiBZKx7MnpbEhh9jyipgxe19OcubqV5w
April 1, 2024
83272
Belize
BLZ
true
2
1
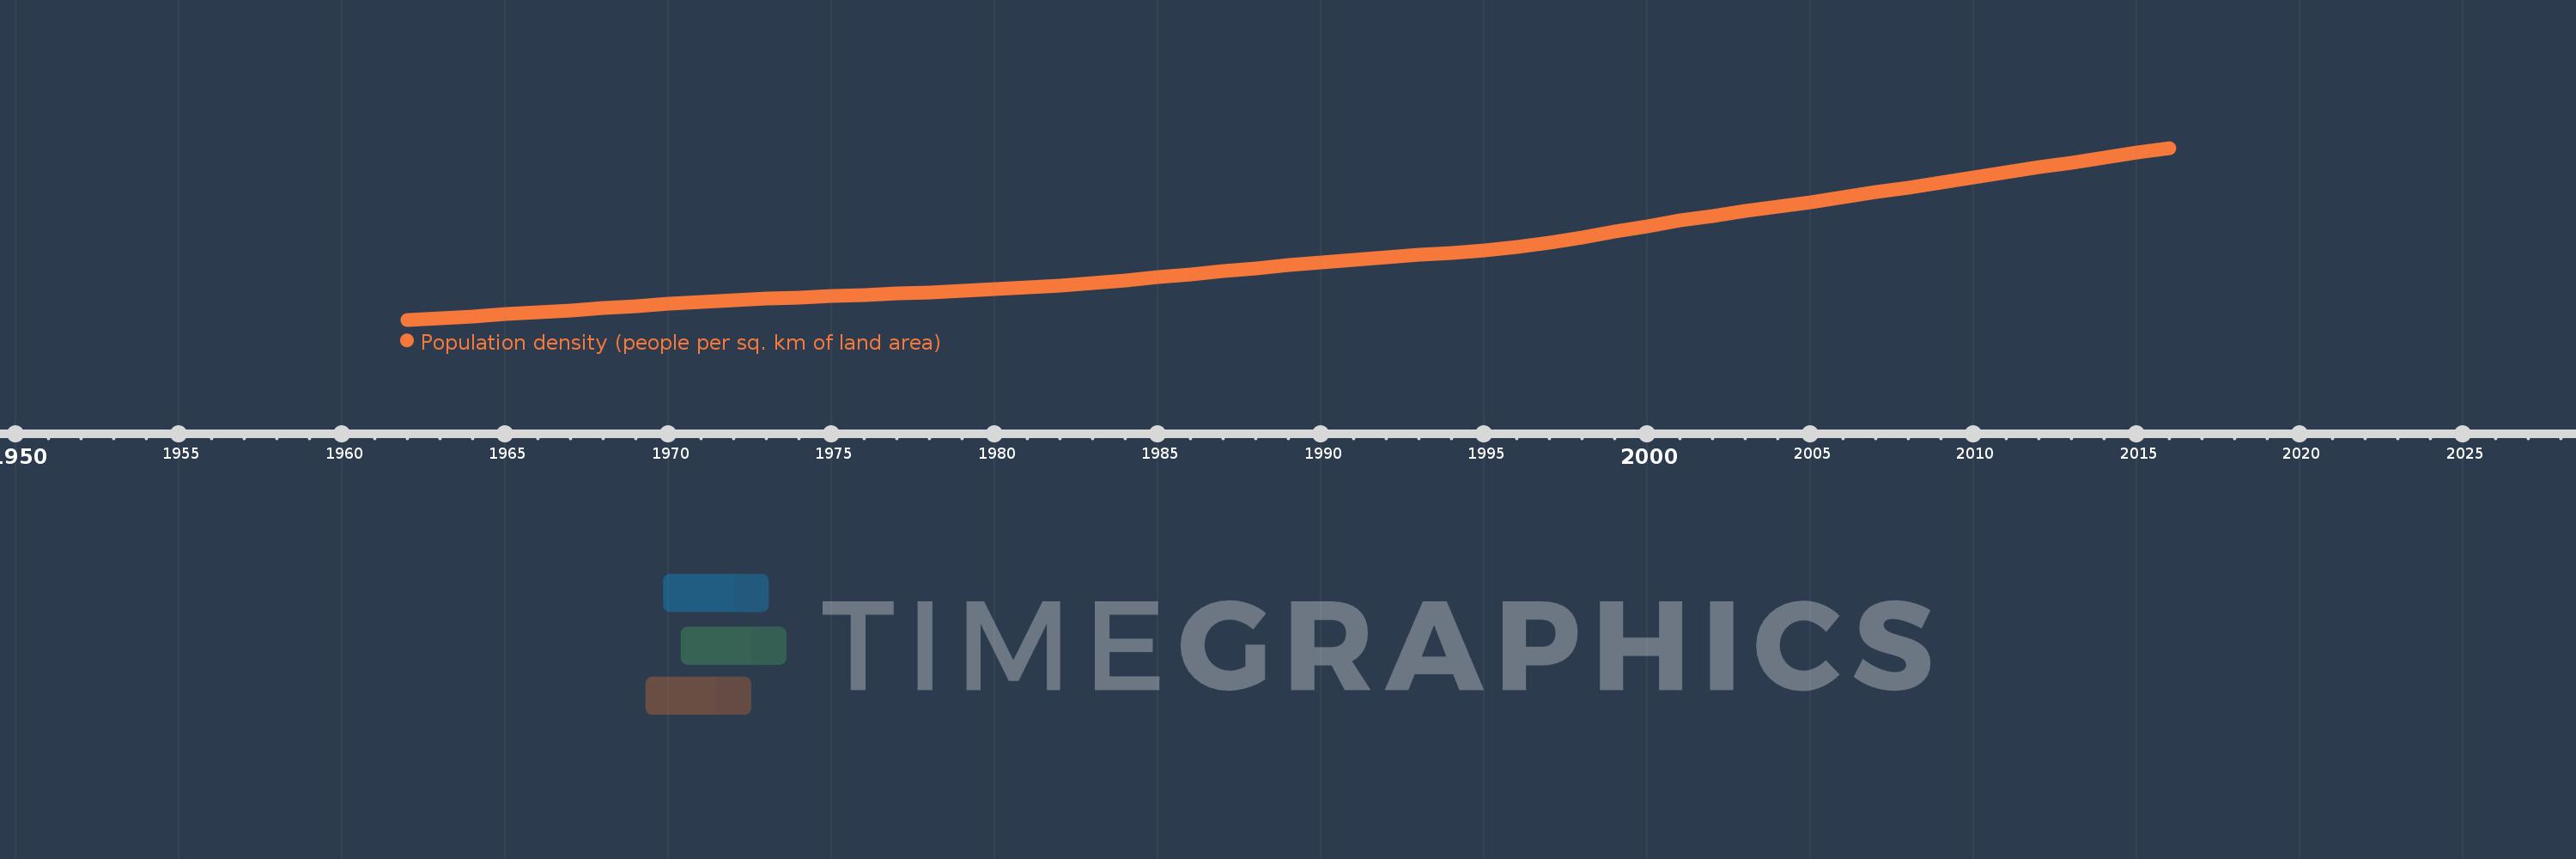
Population density (people per sq. km of land area)
2016,2015,2014,2013,2012,2011,2010,2009,2008,2007,2006,2005,2004,2003,2002,2001,2000,1999,1998,1997,1996,1995,1994,1993,1992,1991,1990,1989,1988,1987,1986,1985,1984,1983,1982,1981,1980,1979,1978,1977,1976,1975,1974,1973,1972,1971,1970,1969,1968,1967,1966,1965,1964,1963,1962
Estas estadísticas en otros países:
AfghanistanAlbaniaAlgeriaAmerican SamoaAndorraAngolaAntigua and BarbudaArab WorldArgentinaArmeniaArubaAustraliaAustriaAzerbaijanBahamas, TheBahrainBangladeshBarbadosBelarusBelgiumBelizeBeninBermudaBhutanBoliviaBosnia and HerzegovinaBotswanaBrazilBritish Virgin IslandsBrunei DarussalamBulgariaBurkina FasoBurundiCabo VerdeCambodiaCameroonCanadaCaribbean small statesCayman IslandsCentral African RepublicCentral Europe and the BalticsChadChannel IslandsChileChinaColombiaComorosCongo, Dem. Rep.Congo, Rep.Costa RicaCote d'IvoireCroatiaCubaCuracaoCyprusCzech RepublicDenmarkDjiboutiDominicaDominican RepublicEarly-demographic dividendEast Asia & PacificEast Asia & Pacific (excluding high income)East Asia & Pacific (IDA & IBRD countries)EcuadorEgypt, Arab Rep.El SalvadorEquatorial GuineaEritreaEstoniaEthiopiaEuro areaEurope & Central AsiaEurope & Central Asia (excluding high income)Europe & Central Asia (IDA & IBRD countries)European UnionFaroe IslandsFijiFinlandFragile and conflict affected situationsFranceFrench PolynesiaGabonGambia, TheGeorgiaGermanyGhanaGibraltarGreeceGreenlandGrenadaGuamGuatemalaGuineaGuinea-BissauGuyanaHaitiHeavily indebted poor countries (HIPC)High incomeHondurasHong Kong SAR, ChinaHungaryIBRD onlyIcelandIDA & IBRD totalIDA blendIDA onlyIDA totalIndiaIndonesiaIran, Islamic Rep.IraqIrelandIsle of ManIsraelItalyJamaicaJapanJordanKazakhstanKenyaKiribatiKorea, Dem. People’s Rep.Korea, Rep.KosovoKuwaitKyrgyz RepublicLao PDRLate-demographic dividendLatin America & Caribbean Latin America & Caribbean (excluding high income)Latin America & the Caribbean (IDA & IBRD countries)LatviaLeast developed countries: UN classificationLebanonLesothoLiberiaLibyaLiechtensteinLithuaniaLow & middle incomeLow incomeLower middle incomeLuxembourgMacao SAR, ChinaMacedonia, FYRMadagascarMalawiMalaysiaMaldivesMaliMaltaMarshall IslandsMauritaniaMauritiusMexicoMicronesia, Fed. Sts.Middle East & North AfricaMiddle East & North Africa (excluding high income)Middle East & North Africa (IDA & IBRD countries)Middle incomeMoldovaMonacoMongoliaMontenegroMoroccoMozambiqueMyanmarNamibiaNauruNepalNetherlandsNew CaledoniaNew ZealandNicaraguaNigerNigeriaNorth AmericaNorthern Mariana IslandsNorwayOECD membersOmanOther small statesPacific island small statesPakistanPalauPanamaPapua New GuineaParaguayPeruPhilippinesPolandPortugalPost-demographic dividendPre-demographic dividendPuerto RicoQatarRomaniaRussian FederationRwandaSamoaSan MarinoSao Tome and PrincipeSaudi ArabiaSenegalSerbiaSeychellesSierra LeoneSingaporeSint Maarten (Dutch part)Slovak RepublicSloveniaSmall statesSolomon IslandsSomaliaSouth AfricaSouth AsiaSouth Asia (IDA & IBRD)SpainSri LankaSt. Kitts and NevisSt. LuciaSt. Martin (French part)St. Vincent and the GrenadinesSub-Saharan Africa Sub-Saharan Africa (excluding high income)Sub-Saharan Africa (IDA & IBRD countries)SudanSurinameSwazilandSwedenSwitzerlandSyrian Arab RepublicTajikistanTanzaniaThailandTimor-LesteTogoTongaTrinidad and TobagoTunisiaTurkeyTurkmenistanTurks and Caicos IslandsTuvaluUgandaUkraineUnited Arab EmiratesUnited KingdomUnited StatesUpper middle incomeUruguayUzbekistanVanuatuVenezuela, RBVietnamVirgin Islands (U.S.)West Bank and GazaWorldYemen, Rep.ZambiaZimbabwe línea de tiempo (timeline):
En esta escala de tiempo se presenta un gráfico de 1962 y 2016 de Belize. Los datos de 1961 están ausentes. El número de observaciones reales por fecha: 55.
Fuente (nombre):
Indicadores del desarrollo mundial
Fuente (organización):
Food and Agriculture Organization and World Bank population estimates.
Categorías:
Urban Development
Se ha actualizado:
23 abr 2017 año
Los indicadores de los cambios de valor en los últimos años
Mínimo:
4.152
1 ene 1962 año
Máximo:
15.751
1 ene 2016 año
A la fecha de observación
Valor
Cambio absoluto
El cambio con respecto al valor anterior
1 ene 1962 año
4.152
+4.152
0.0%
1 ene 1963 año
4.27
+0.118
2.84%
1 ene 1964 año
4.391
+0.122
2.85%
1 ene 1965 año
4.519
+0.127
2.9%
1 ene 1966 año
4.652
+0.134
2.96%
1 ene 1967 año
4.794
+0.141
3.04%
1 ene 1968 año
4.941
+0.147
3.07%
1 ene 1969 año
5.088
+0.147
2.98%
1 ene 1970 año
5.228
+0.14
2.76%
1 ene 1971 año
5.356
+0.128
2.45%
1 ene 1972 año
5.471
+0.115
2.14%
1 ene 1973 año
5.574
+0.103
1.89%
1 ene 1974 año
5.668
+0.094
1.69%
1 ene 1975 año
5.757
+0.088
1.56%
1 ene 1976 año
5.842
+0.086
1.49%
1 ene 1977 año
5.925
+0.083
1.41%
1 ene 1978 año
6.006
+0.081
1.37%
1 ene 1979 año
6.093
+0.087
1.45%
1 ene 1980 año
6.195
+0.102
1.68%
1 ene 1981 año
6.32
+0.125
2.01%
1 ene 1982 año
6.469
+0.15
2.37%
1 ene 1983 año
6.642
+0.172
2.66%
1 ene 1984 año
6.831
+0.189
2.85%
1 ene 1985 año
7.029
+0.198
2.9%
1 ene 1986 año
7.23
+0.201
2.85%
1 ene 1987 año
7.434
+0.204
2.82%
1 ene 1988 año
7.643
+0.209
2.8%
1 ene 1989 año
7.849
+0.206
2.7%
1 ene 1990 año
8.043
+0.195
2.48%
1 ene 1991 año
8.222
+0.179
2.22%
1 ene 1992 año
8.379
+0.157
1.91%
1 ene 1993 año
8.519
+0.14
1.67%
1 ene 1994 año
8.664
+0.144
1.7%
1 ene 1995 año
8.842
+0.178
2.06%
1 ene 1996 año
9.073
+0.232
2.62%
1 ene 1997 año
9.368
+0.294
3.24%
1 ene 1998 año
9.715
+0.348
3.71%
1 ene 1999 año
10.096
+0.381
3.92%
1 ene 2000 año
10.479
+0.383
3.79%
1 ene 2001 año
10.842
+0.363
3.47%
1 ene 2002 año
11.179
+0.337
3.1%
1 ene 2003 año
11.495
+0.316
2.83%
1 ene 2004 año
11.799
+0.304
2.64%
1 ene 2005 año
12.104
+0.305
2.58%
1 ene 2006 año
12.419
+0.315
2.61%
1 ene 2007 año
12.747
+0.328
2.64%
1 ene 2008 año
13.082
+0.335
2.63%
1 ene 2009 año
13.422
+0.34
2.6%
1 ene 2010 año
13.763
+0.34
2.53%
1 ene 2011 año
14.099
+0.337
2.45%
1 ene 2012 año
14.432
+0.332
2.36%
1 ene 2013 año
14.761
+0.329
2.28%
1 ene 2014 año
15.09
+0.328
2.22%
1 ene 2015 año
15.419
+0.329
2.18%
1 ene 2016 año
15.751
+0.332
2.16%
Ranking de los países por los datos estadísticos actuales


Comentarios: