29
/es/
es
AIzaSyAYiBZKx7MnpbEhh9jyipgxe19OcubqV5w
April 1, 2024
69172
Antigua and Barbuda
ATG
true
2
1
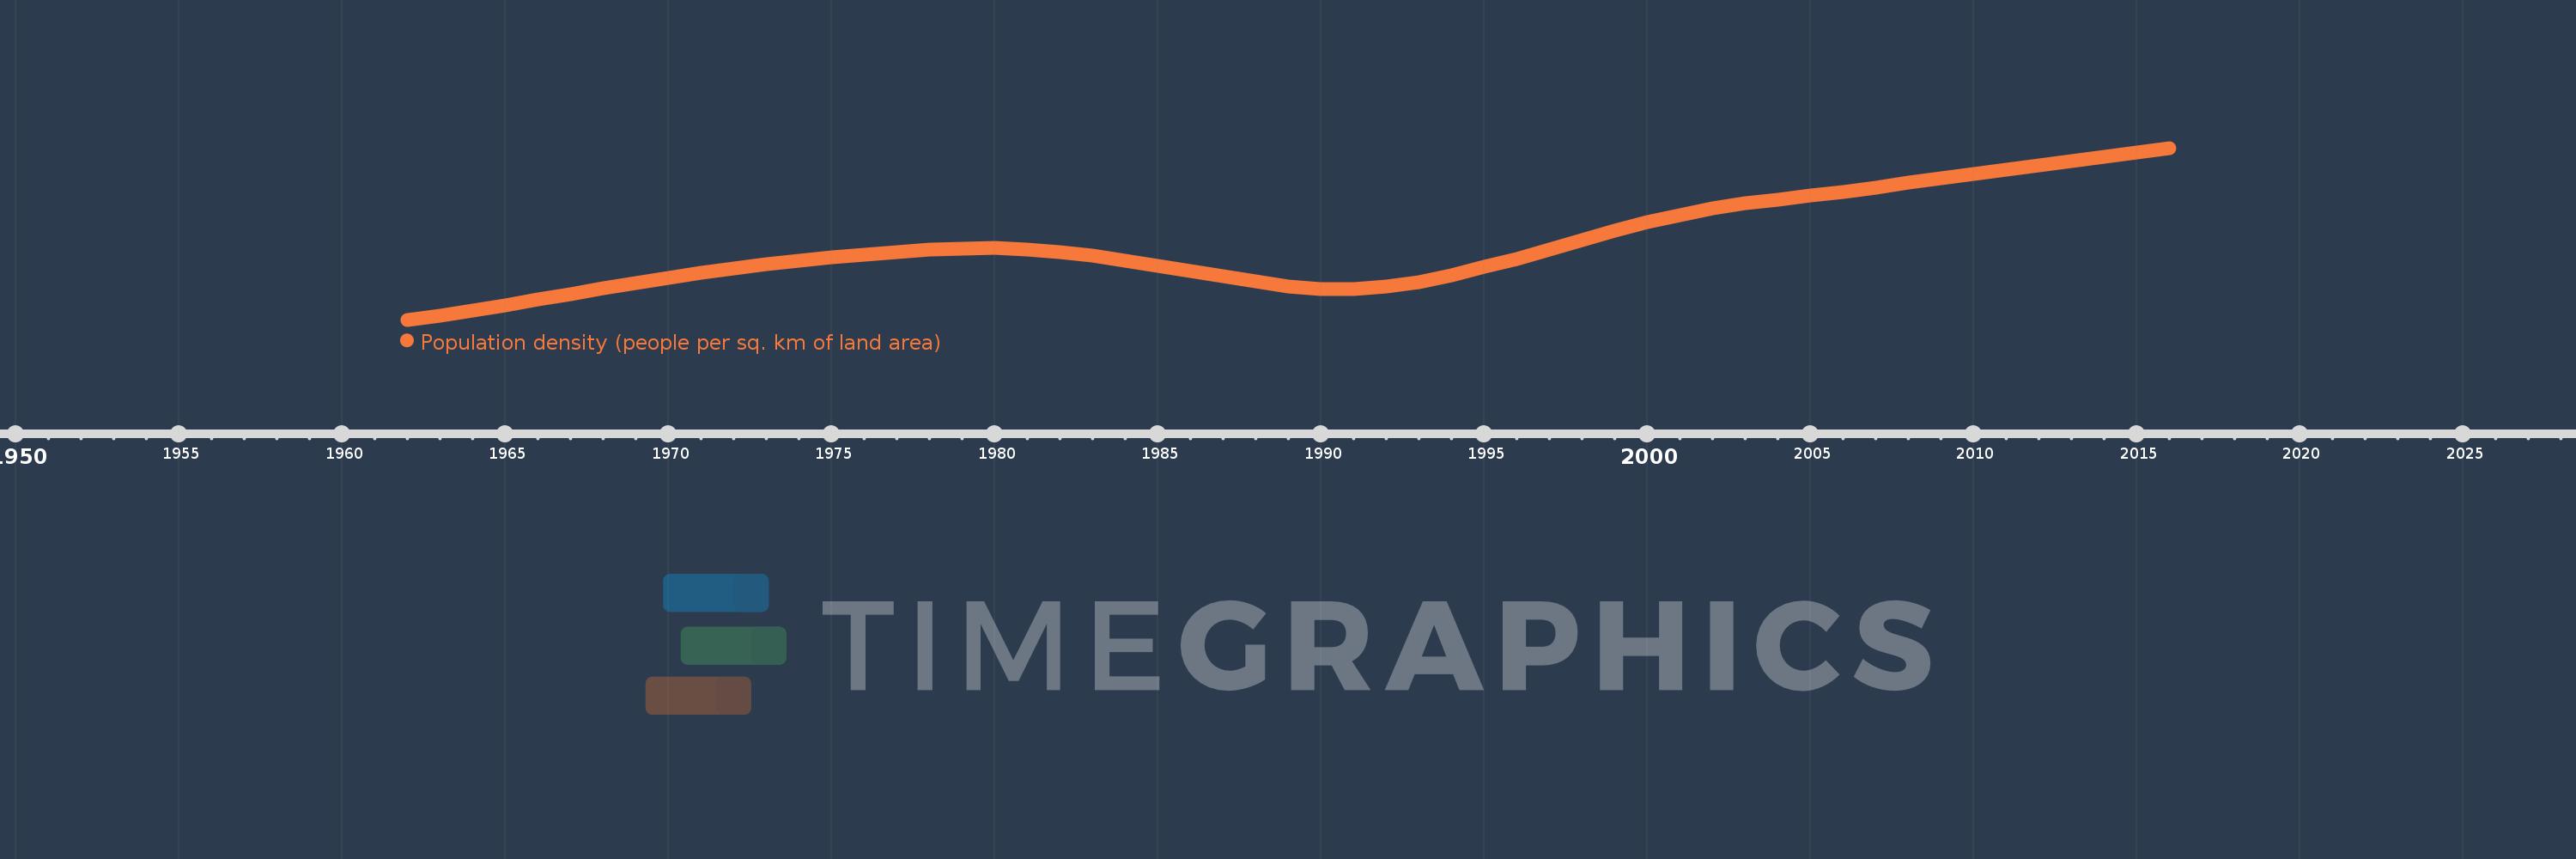
Population density (people per sq. km of land area)
2016,2015,2014,2013,2012,2011,2010,2009,2008,2007,2006,2005,2004,2003,2002,2001,2000,1999,1998,1997,1996,1995,1994,1993,1992,1991,1990,1989,1988,1987,1986,1985,1984,1983,1982,1981,1980,1979,1978,1977,1976,1975,1974,1973,1972,1971,1970,1969,1968,1967,1966,1965,1964,1963,1962
Estas estadísticas en otros países:
AfghanistanAlbaniaAlgeriaAmerican SamoaAndorraAngolaAntigua and BarbudaArab WorldArgentinaArmeniaArubaAustraliaAustriaAzerbaijanBahamas, TheBahrainBangladeshBarbadosBelarusBelgiumBelizeBeninBermudaBhutanBoliviaBosnia and HerzegovinaBotswanaBrazilBritish Virgin IslandsBrunei DarussalamBulgariaBurkina FasoBurundiCabo VerdeCambodiaCameroonCanadaCaribbean small statesCayman IslandsCentral African RepublicCentral Europe and the BalticsChadChannel IslandsChileChinaColombiaComorosCongo, Dem. Rep.Congo, Rep.Costa RicaCote d'IvoireCroatiaCubaCuracaoCyprusCzech RepublicDenmarkDjiboutiDominicaDominican RepublicEarly-demographic dividendEast Asia & PacificEast Asia & Pacific (excluding high income)East Asia & Pacific (IDA & IBRD countries)EcuadorEgypt, Arab Rep.El SalvadorEquatorial GuineaEritreaEstoniaEthiopiaEuro areaEurope & Central AsiaEurope & Central Asia (excluding high income)Europe & Central Asia (IDA & IBRD countries)European UnionFaroe IslandsFijiFinlandFragile and conflict affected situationsFranceFrench PolynesiaGabonGambia, TheGeorgiaGermanyGhanaGibraltarGreeceGreenlandGrenadaGuamGuatemalaGuineaGuinea-BissauGuyanaHaitiHeavily indebted poor countries (HIPC)High incomeHondurasHong Kong SAR, ChinaHungaryIBRD onlyIcelandIDA & IBRD totalIDA blendIDA onlyIDA totalIndiaIndonesiaIran, Islamic Rep.IraqIrelandIsle of ManIsraelItalyJamaicaJapanJordanKazakhstanKenyaKiribatiKorea, Dem. People’s Rep.Korea, Rep.KosovoKuwaitKyrgyz RepublicLao PDRLate-demographic dividendLatin America & Caribbean Latin America & Caribbean (excluding high income)Latin America & the Caribbean (IDA & IBRD countries)LatviaLeast developed countries: UN classificationLebanonLesothoLiberiaLibyaLiechtensteinLithuaniaLow & middle incomeLow incomeLower middle incomeLuxembourgMacao SAR, ChinaMacedonia, FYRMadagascarMalawiMalaysiaMaldivesMaliMaltaMarshall IslandsMauritaniaMauritiusMexicoMicronesia, Fed. Sts.Middle East & North AfricaMiddle East & North Africa (excluding high income)Middle East & North Africa (IDA & IBRD countries)Middle incomeMoldovaMonacoMongoliaMontenegroMoroccoMozambiqueMyanmarNamibiaNauruNepalNetherlandsNew CaledoniaNew ZealandNicaraguaNigerNigeriaNorth AmericaNorthern Mariana IslandsNorwayOECD membersOmanOther small statesPacific island small statesPakistanPalauPanamaPapua New GuineaParaguayPeruPhilippinesPolandPortugalPost-demographic dividendPre-demographic dividendPuerto RicoQatarRomaniaRussian FederationRwandaSamoaSan MarinoSao Tome and PrincipeSaudi ArabiaSenegalSerbiaSeychellesSierra LeoneSingaporeSint Maarten (Dutch part)Slovak RepublicSloveniaSmall statesSolomon IslandsSomaliaSouth AfricaSouth AsiaSouth Asia (IDA & IBRD)SpainSri LankaSt. Kitts and NevisSt. LuciaSt. Martin (French part)St. Vincent and the GrenadinesSub-Saharan Africa Sub-Saharan Africa (excluding high income)Sub-Saharan Africa (IDA & IBRD countries)SudanSurinameSwazilandSwedenSwitzerlandSyrian Arab RepublicTajikistanTanzaniaThailandTimor-LesteTogoTongaTrinidad and TobagoTunisiaTurkeyTurkmenistanTurks and Caicos IslandsTuvaluUgandaUkraineUnited Arab EmiratesUnited KingdomUnited StatesUpper middle incomeUruguayUzbekistanVanuatuVenezuela, RBVietnamVirgin Islands (U.S.)West Bank and GazaWorldYemen, Rep.ZambiaZimbabwe línea de tiempo (timeline):
En esta escala de tiempo se presenta un gráfico de 1962 y 2016 de Antigua and Barbuda. Los datos de 1961 están ausentes. El número de observaciones reales por fecha: 55.
Fuente (nombre):
Indicadores del desarrollo mundial
Fuente (organización):
Food and Agriculture Organization and World Bank population estimates.
Categorías:
Urban Development
Se ha actualizado:
23 abr 2017 año
Los indicadores de los cambios de valor en los últimos años
Mínimo:
125.916
1 ene 1962 año
Máximo:
208.677
1 ene 2016 año
A la fecha de observación
Valor
Cambio absoluto
El cambio con respecto al valor anterior
1 ene 1962 año
125.916
+125.916
0.0%
1 ene 1963 año
127.98
+2.064
1.64%
1 ene 1964 año
130.382
+2.402
1.88%
1 ene 1965 año
132.955
+2.573
1.97%
1 ene 1966 año
135.575
+2.62
1.97%
1 ene 1967 año
138.223
+2.648
1.95%
1 ene 1968 año
140.914
+2.691
1.95%
1 ene 1969 año
143.582
+2.668
1.89%
1 ene 1970 año
146.152
+2.57
1.79%
1 ene 1971 año
148.566
+2.414
1.65%
1 ene 1972 año
150.768
+2.202
1.48%
1 ene 1973 año
152.739
+1.97
1.31%
1 ene 1974 año
154.482
+1.743
1.14%
1 ene 1975 año
156.034
+1.552
1.0%
1 ene 1976 año
157.393
+1.359
0.87%
1 ene 1977 año
158.595
+1.202
0.76%
1 ene 1978 año
159.598
+1.002
0.63%
1 ene 1979 año
160.245
+0.648
0.41%
1 ene 1980 año
160.348
+0.102
0.06%
1 ene 1981 año
159.775
-0.573
-0.36%
1 ene 1982 año
158.523
-1.252
-0.78%
1 ene 1983 año
156.705
-1.818
-1.15%
1 ene 1984 año
154.45
-2.255
-1.44%
1 ene 1985 año
151.961
-2.489
-1.61%
1 ene 1986 año
149.418
-2.543
-1.67%
1 ene 1987 año
146.83
-2.589
-1.73%
1 ene 1988 año
144.282
-2.548
-1.74%
1 ene 1989 año
142.132
-2.15
-1.49%
1 ene 1990 año
140.834
-1.298
-0.91%
1 ene 1991 año
140.695
-0.139
-0.1%
1 ene 1992 año
141.845
+1.15
0.82%
1 ene 1993 año
144.168
+2.323
1.64%
1 ene 1994 año
147.427
+3.259
2.26%
1 ene 1995 año
151.25
+3.823
2.59%
1 ene 1996 año
155.339
+4.089
2.7%
1 ene 1997 año
159.648
+4.309
2.77%
1 ene 1998 año
164.164
+4.516
2.83%
1 ene 1999 año
168.65
+4.486
2.73%
1 ene 2000 año
172.82
+4.17
2.47%
1 ene 2001 año
176.473
+3.652
2.11%
1 ene 2002 año
179.482
+3.009
1.71%
1 ene 2003 año
181.886
+2.405
1.34%
1 ene 2004 año
183.873
+1.986
1.09%
1 ene 2005 año
185.723
+1.85
1.01%
1 ene 2006 año
187.648
+1.925
1.04%
1 ene 2007 año
189.698
+2.05
1.09%
1 ene 2008 año
191.811
+2.114
1.11%
1 ene 2009 año
193.977
+2.166
1.13%
1 ene 2010 año
196.136
+2.159
1.11%
1 ene 2011 año
198.257
+2.12
1.08%
1 ene 2012 año
200.345
+2.089
1.05%
1 ene 2013 año
202.43
+2.084
1.04%
1 ene 2014 año
204.511
+2.082
1.03%
1 ene 2015 año
206.591
+2.08
1.02%
1 ene 2016 año
208.677
+2.086
1.01%
Ranking de los países por los datos estadísticos actuales


Comentarios: