29
/es/
es
AIzaSyAYiBZKx7MnpbEhh9jyipgxe19OcubqV5w
April 1, 2024
227785
Qatar
QAT
true
2
1
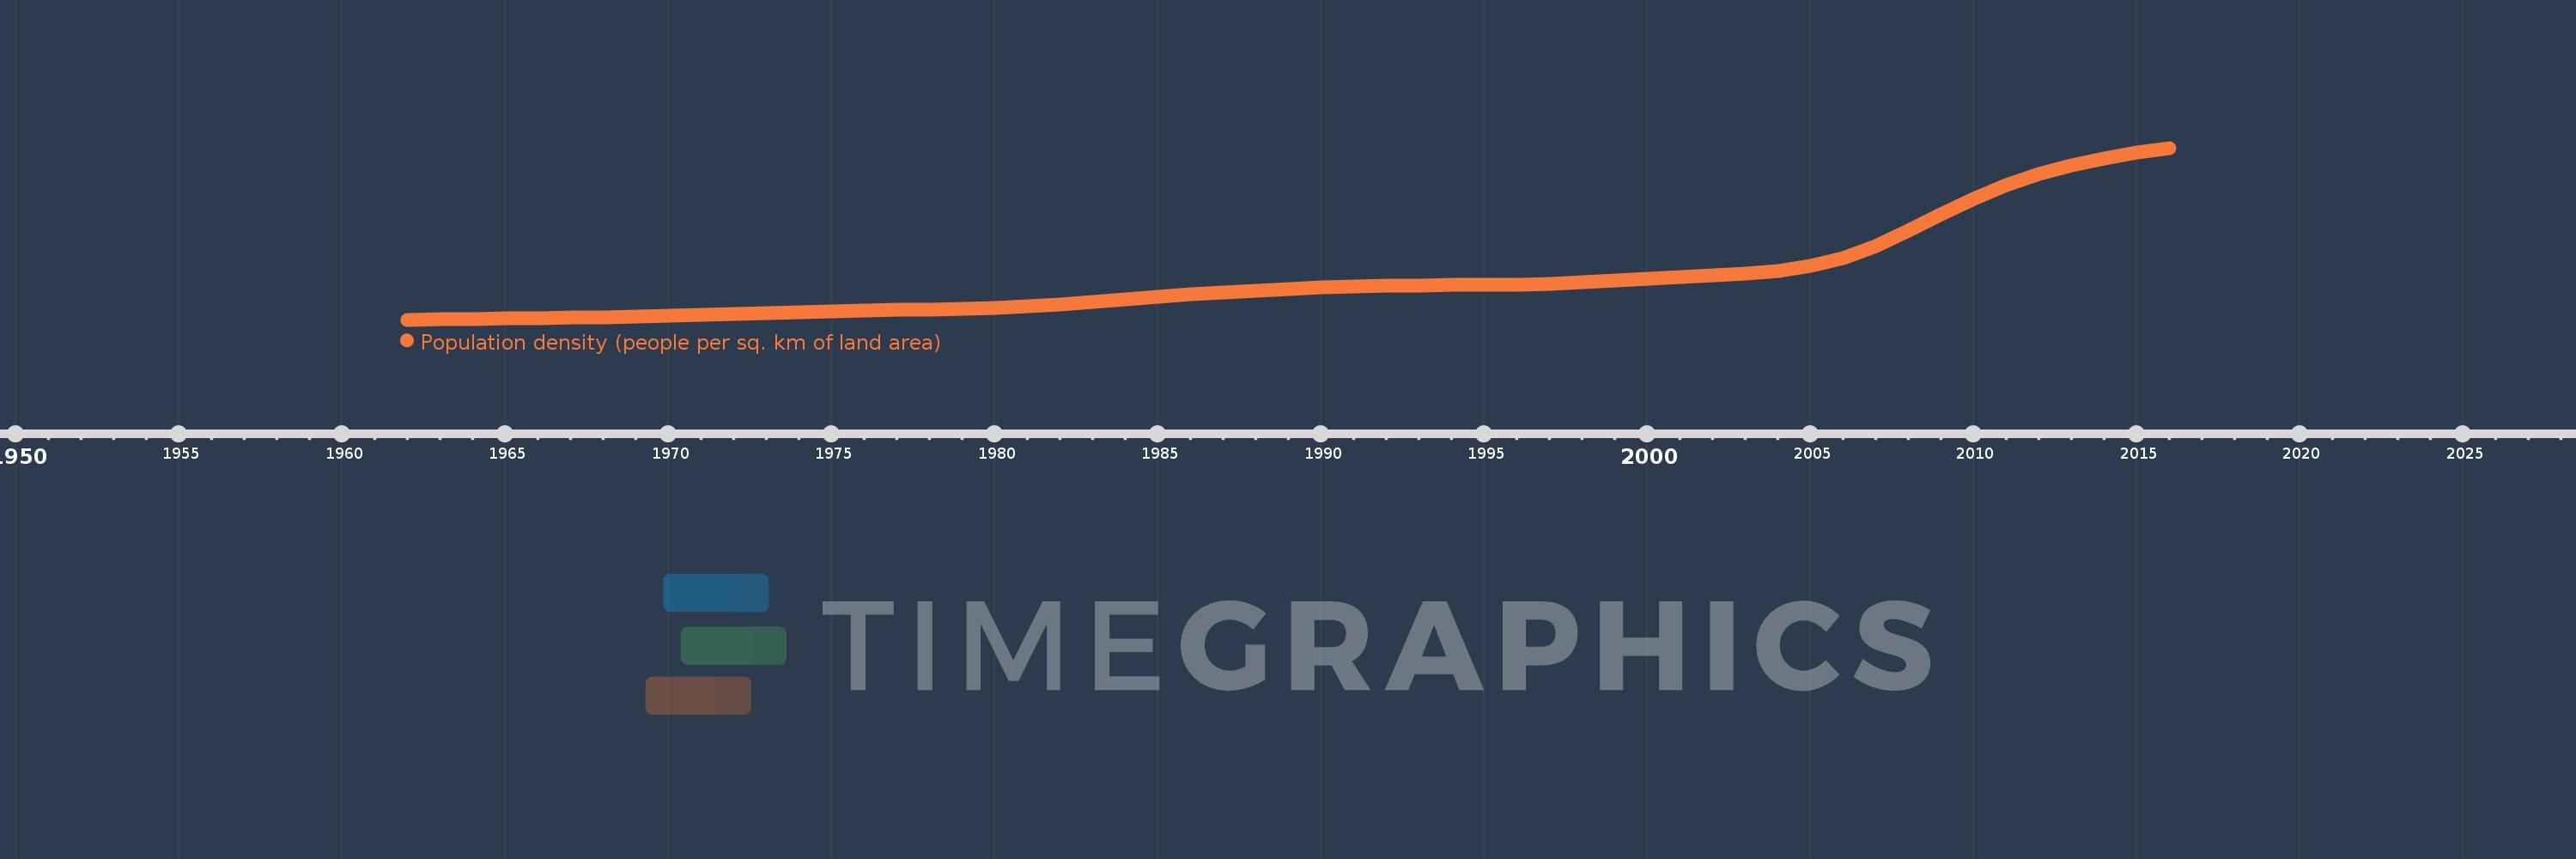
Population density (people per sq. km of land area)
2016,2015,2014,2013,2012,2011,2010,2009,2008,2007,2006,2005,2004,2003,2002,2001,2000,1999,1998,1997,1996,1995,1994,1993,1992,1991,1990,1989,1988,1987,1986,1985,1984,1983,1982,1981,1980,1979,1978,1977,1976,1975,1974,1973,1972,1971,1970,1969,1968,1967,1966,1965,1964,1963,1962
Estas estadísticas en otros países:
AfghanistanAlbaniaAlgeriaAmerican SamoaAndorraAngolaAntigua and BarbudaArab WorldArgentinaArmeniaArubaAustraliaAustriaAzerbaijanBahamas, TheBahrainBangladeshBarbadosBelarusBelgiumBelizeBeninBermudaBhutanBoliviaBosnia and HerzegovinaBotswanaBrazilBritish Virgin IslandsBrunei DarussalamBulgariaBurkina FasoBurundiCabo VerdeCambodiaCameroonCanadaCaribbean small statesCayman IslandsCentral African RepublicCentral Europe and the BalticsChadChannel IslandsChileChinaColombiaComorosCongo, Dem. Rep.Congo, Rep.Costa RicaCote d'IvoireCroatiaCubaCuracaoCyprusCzech RepublicDenmarkDjiboutiDominicaDominican RepublicEarly-demographic dividendEast Asia & PacificEast Asia & Pacific (excluding high income)East Asia & Pacific (IDA & IBRD countries)EcuadorEgypt, Arab Rep.El SalvadorEquatorial GuineaEritreaEstoniaEthiopiaEuro areaEurope & Central AsiaEurope & Central Asia (excluding high income)Europe & Central Asia (IDA & IBRD countries)European UnionFaroe IslandsFijiFinlandFragile and conflict affected situationsFranceFrench PolynesiaGabonGambia, TheGeorgiaGermanyGhanaGibraltarGreeceGreenlandGrenadaGuamGuatemalaGuineaGuinea-BissauGuyanaHaitiHeavily indebted poor countries (HIPC)High incomeHondurasHong Kong SAR, ChinaHungaryIBRD onlyIcelandIDA & IBRD totalIDA blendIDA onlyIDA totalIndiaIndonesiaIran, Islamic Rep.IraqIrelandIsle of ManIsraelItalyJamaicaJapanJordanKazakhstanKenyaKiribatiKorea, Dem. People’s Rep.Korea, Rep.KosovoKuwaitKyrgyz RepublicLao PDRLate-demographic dividendLatin America & Caribbean Latin America & Caribbean (excluding high income)Latin America & the Caribbean (IDA & IBRD countries)LatviaLeast developed countries: UN classificationLebanonLesothoLiberiaLibyaLiechtensteinLithuaniaLow & middle incomeLow incomeLower middle incomeLuxembourgMacao SAR, ChinaMacedonia, FYRMadagascarMalawiMalaysiaMaldivesMaliMaltaMarshall IslandsMauritaniaMauritiusMexicoMicronesia, Fed. Sts.Middle East & North AfricaMiddle East & North Africa (excluding high income)Middle East & North Africa (IDA & IBRD countries)Middle incomeMoldovaMonacoMongoliaMontenegroMoroccoMozambiqueMyanmarNamibiaNauruNepalNetherlandsNew CaledoniaNew ZealandNicaraguaNigerNigeriaNorth AmericaNorthern Mariana IslandsNorwayOECD membersOmanOther small statesPacific island small statesPakistanPalauPanamaPapua New GuineaParaguayPeruPhilippinesPolandPortugalPost-demographic dividendPre-demographic dividendPuerto RicoQatarRomaniaRussian FederationRwandaSamoaSan MarinoSao Tome and PrincipeSaudi ArabiaSenegalSerbiaSeychellesSierra LeoneSingaporeSint Maarten (Dutch part)Slovak RepublicSloveniaSmall statesSolomon IslandsSomaliaSouth AfricaSouth AsiaSouth Asia (IDA & IBRD)SpainSri LankaSt. Kitts and NevisSt. LuciaSt. Martin (French part)St. Vincent and the GrenadinesSub-Saharan Africa Sub-Saharan Africa (excluding high income)Sub-Saharan Africa (IDA & IBRD countries)SudanSurinameSwazilandSwedenSwitzerlandSyrian Arab RepublicTajikistanTanzaniaThailandTimor-LesteTogoTongaTrinidad and TobagoTunisiaTurkeyTurkmenistanTurks and Caicos IslandsTuvaluUgandaUkraineUnited Arab EmiratesUnited KingdomUnited StatesUpper middle incomeUruguayUzbekistanVanuatuVenezuela, RBVietnamVirgin Islands (U.S.)West Bank and GazaWorldYemen, Rep.ZambiaZimbabwe línea de tiempo (timeline):
En esta escala de tiempo se presenta un gráfico de 1962 y 2016 de Qatar. Los datos de 1961 están ausentes. El número de observaciones reales por fecha: 55.
Fuente (nombre):
Indicadores del desarrollo mundial
Fuente (organización):
Food and Agriculture Organization and World Bank population estimates.
Categorías:
Urban Development
Se ha actualizado:
23 abr 2017 año
Los indicadores de los cambios de valor en los últimos años
Mínimo:
4.423
1 ene 1962 año
Máximo:
192.537
1 ene 2016 año
A la fecha de observación
Valor
Cambio absoluto
El cambio con respecto al valor anterior
1 ene 1962 año
4.423
+4.423
0.0%
1 ene 1963 año
4.84
+0.416
9.41%
1 ene 1964 año
5.31
+0.47
9.72%
1 ene 1965 año
5.813
+0.503
9.47%
1 ene 1966 año
6.334
+0.522
8.97%
1 ene 1967 año
6.868
+0.533
8.42%
1 ene 1968 año
7.421
+0.553
8.06%
1 ene 1969 año
8.014
+0.593
7.99%
1 ene 1970 año
8.673
+0.659
8.23%
1 ene 1971 año
9.417
+0.743
8.57%
1 ene 1972 año
10.271
+0.854
9.07%
1 ene 1973 año
11.23
+0.959
9.33%
1 ene 1974 año
12.24
+1.011
9.0%
1 ene 1975 año
13.229
+0.989
8.08%
1 ene 1976 año
14.154
+0.925
6.99%
1 ene 1977 año
14.966
+0.812
5.74%
1 ene 1978 año
15.708
+0.742
4.96%
1 ene 1979 año
16.539
+0.831
5.29%
1 ene 1980 año
17.678
+1.139
6.89%
1 ene 1981 año
19.269
+1.591
9.0%
1 ene 1982 año
21.365
+2.096
10.88%
1 ene 1983 año
23.88
+2.514
11.77%
1 ene 1984 año
26.639
+2.759
11.55%
1 ene 1985 año
29.396
+2.757
10.35%
1 ene 1986 año
31.961
+2.565
8.73%
1 ene 1987 año
34.309
+2.348
7.34%
1 ene 1988 año
36.462
+2.153
6.28%
1 ene 1989 año
38.347
+1.884
5.17%
1 ene 1990 año
39.885
+1.538
4.01%
1 ene 1991 año
41.04
+1.156
2.9%
1 ene 1992 año
41.784
+0.744
1.81%
1 ene 1993 año
42.176
+0.392
0.94%
1 ene 1994 año
42.388
+0.211
0.5%
1 ene 1995 año
42.651
+0.263
0.62%
1 ene 1996 año
43.154
+0.503
1.18%
1 ene 1997 año
44.088
+0.934
2.16%
1 ene 1998 año
45.496
+1.408
3.19%
1 ene 1999 año
47.254
+1.758
3.86%
1 ene 2000 año
49.151
+1.897
4.01%
1 ene 2001 año
51.116
+1.965
4.0%
1 ene 2002 año
52.861
+1.746
3.42%
1 ene 2003 año
54.642
+1.78
3.37%
1 ene 2004 año
57.551
+2.909
5.32%
1 ene 2005 año
63.057
+5.507
9.57%
1 ene 2006 año
72.086
+9.029
14.32%
1 ene 2007 año
85.138
+13.051
18.1%
1 ene 2008 año
101.547
+16.409
19.27%
1 ene 2009 año
119.635
+18.088
17.81%
1 ene 2010 año
137.05
+17.415
14.56%
1 ene 2011 año
152.068
+15.018
10.96%
1 ene 2012 año
164.12
+12.052
7.93%
1 ene 2013 año
173.611
+9.491
5.78%
1 ene 2014 año
180.989
+7.378
4.25%
1 ene 2015 año
187.086
+6.096
3.37%
1 ene 2016 año
192.537
+5.451
2.91%
Ranking de los países por los datos estadísticos actuales


Comentarios: