29
/es/
es
AIzaSyAYiBZKx7MnpbEhh9jyipgxe19OcubqV5w
April 1, 2024
66497
Algeria
DZA
true
2
1
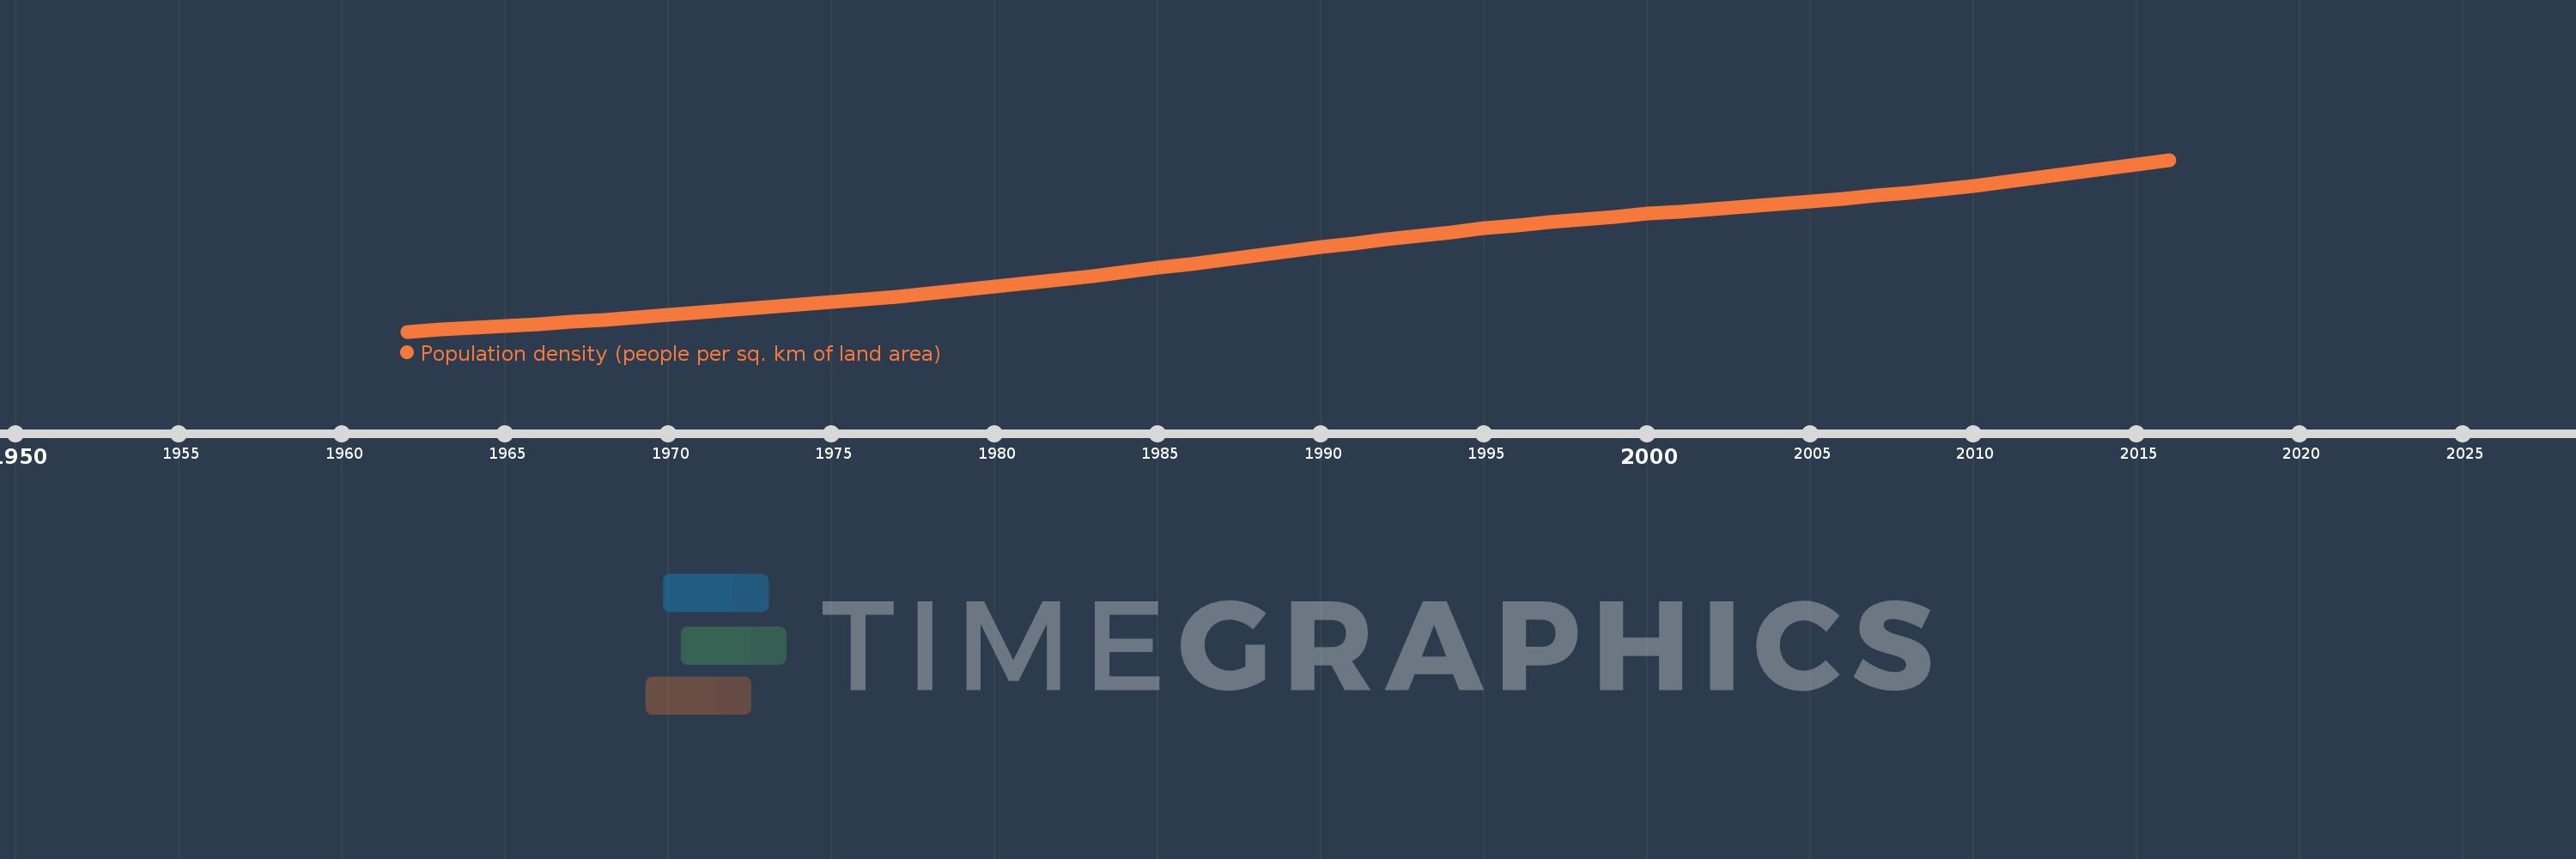
Population density (people per sq. km of land area)
2016,2015,2014,2013,2012,2011,2010,2009,2008,2007,2006,2005,2004,2003,2002,2001,2000,1999,1998,1997,1996,1995,1994,1993,1992,1991,1990,1989,1988,1987,1986,1985,1984,1983,1982,1981,1980,1979,1978,1977,1976,1975,1974,1973,1972,1971,1970,1969,1968,1967,1966,1965,1964,1963,1962
Estas estadísticas en otros países:
AfghanistanAlbaniaAlgeriaAmerican SamoaAndorraAngolaAntigua and BarbudaArab WorldArgentinaArmeniaArubaAustraliaAustriaAzerbaijanBahamas, TheBahrainBangladeshBarbadosBelarusBelgiumBelizeBeninBermudaBhutanBoliviaBosnia and HerzegovinaBotswanaBrazilBritish Virgin IslandsBrunei DarussalamBulgariaBurkina FasoBurundiCabo VerdeCambodiaCameroonCanadaCaribbean small statesCayman IslandsCentral African RepublicCentral Europe and the BalticsChadChannel IslandsChileChinaColombiaComorosCongo, Dem. Rep.Congo, Rep.Costa RicaCote d'IvoireCroatiaCubaCuracaoCyprusCzech RepublicDenmarkDjiboutiDominicaDominican RepublicEarly-demographic dividendEast Asia & PacificEast Asia & Pacific (excluding high income)East Asia & Pacific (IDA & IBRD countries)EcuadorEgypt, Arab Rep.El SalvadorEquatorial GuineaEritreaEstoniaEthiopiaEuro areaEurope & Central AsiaEurope & Central Asia (excluding high income)Europe & Central Asia (IDA & IBRD countries)European UnionFaroe IslandsFijiFinlandFragile and conflict affected situationsFranceFrench PolynesiaGabonGambia, TheGeorgiaGermanyGhanaGibraltarGreeceGreenlandGrenadaGuamGuatemalaGuineaGuinea-BissauGuyanaHaitiHeavily indebted poor countries (HIPC)High incomeHondurasHong Kong SAR, ChinaHungaryIBRD onlyIcelandIDA & IBRD totalIDA blendIDA onlyIDA totalIndiaIndonesiaIran, Islamic Rep.IraqIrelandIsle of ManIsraelItalyJamaicaJapanJordanKazakhstanKenyaKiribatiKorea, Dem. People’s Rep.Korea, Rep.KosovoKuwaitKyrgyz RepublicLao PDRLate-demographic dividendLatin America & Caribbean Latin America & Caribbean (excluding high income)Latin America & the Caribbean (IDA & IBRD countries)LatviaLeast developed countries: UN classificationLebanonLesothoLiberiaLibyaLiechtensteinLithuaniaLow & middle incomeLow incomeLower middle incomeLuxembourgMacao SAR, ChinaMacedonia, FYRMadagascarMalawiMalaysiaMaldivesMaliMaltaMarshall IslandsMauritaniaMauritiusMexicoMicronesia, Fed. Sts.Middle East & North AfricaMiddle East & North Africa (excluding high income)Middle East & North Africa (IDA & IBRD countries)Middle incomeMoldovaMonacoMongoliaMontenegroMoroccoMozambiqueMyanmarNamibiaNauruNepalNetherlandsNew CaledoniaNew ZealandNicaraguaNigerNigeriaNorth AmericaNorthern Mariana IslandsNorwayOECD membersOmanOther small statesPacific island small statesPakistanPalauPanamaPapua New GuineaParaguayPeruPhilippinesPolandPortugalPost-demographic dividendPre-demographic dividendPuerto RicoQatarRomaniaRussian FederationRwandaSamoaSan MarinoSao Tome and PrincipeSaudi ArabiaSenegalSerbiaSeychellesSierra LeoneSingaporeSint Maarten (Dutch part)Slovak RepublicSloveniaSmall statesSolomon IslandsSomaliaSouth AfricaSouth AsiaSouth Asia (IDA & IBRD)SpainSri LankaSt. Kitts and NevisSt. LuciaSt. Martin (French part)St. Vincent and the GrenadinesSub-Saharan Africa Sub-Saharan Africa (excluding high income)Sub-Saharan Africa (IDA & IBRD countries)SudanSurinameSwazilandSwedenSwitzerlandSyrian Arab RepublicTajikistanTanzaniaThailandTimor-LesteTogoTongaTrinidad and TobagoTunisiaTurkeyTurkmenistanTurks and Caicos IslandsTuvaluUgandaUkraineUnited Arab EmiratesUnited KingdomUnited StatesUpper middle incomeUruguayUzbekistanVanuatuVenezuela, RBVietnamVirgin Islands (U.S.)West Bank and GazaWorldYemen, Rep.ZambiaZimbabwe línea de tiempo (timeline):
En esta escala de tiempo se presenta un gráfico de 1962 y 2016 de Algeria. Los datos de 1961 están ausentes. El número de observaciones reales por fecha: 55.
Fuente (nombre):
Indicadores del desarrollo mundial
Fuente (organización):
Food and Agriculture Organization and World Bank population estimates.
Categorías:
Urban Development
Se ha actualizado:
23 abr 2017 año
Los indicadores de los cambios de valor en los últimos años
Mínimo:
4.788
1 ene 1962 año
Máximo:
16.654
1 ene 2016 año
A la fecha de observación
Valor
Cambio absoluto
El cambio con respecto al valor anterior
1 ene 1962 año
4.788
+4.788
0.0%
1 ene 1963 año
4.908
+0.12
2.5%
1 ene 1964 año
5.032
+0.124
2.52%
1 ene 1965 año
5.163
+0.131
2.59%
1 ene 1966 año
5.302
+0.139
2.69%
1 ene 1967 año
5.45
+0.148
2.8%
1 ene 1968 año
5.607
+0.157
2.88%
1 ene 1969 año
5.771
+0.164
2.92%
1 ene 1970 año
5.939
+0.168
2.91%
1 ene 1971 año
6.109
+0.17
2.87%
1 ene 1972 año
6.281
+0.172
2.82%
1 ene 1973 año
6.456
+0.175
2.79%
1 ene 1974 año
6.636
+0.179
2.78%
1 ene 1975 año
6.822
+0.186
2.8%
1 ene 1976 año
7.016
+0.194
2.84%
1 ene 1977 año
7.218
+0.202
2.88%
1 ene 1978 año
7.427
+0.21
2.91%
1 ene 1979 año
7.647
+0.219
2.95%
1 ene 1980 año
7.877
+0.23
3.01%
1 ene 1981 año
8.119
+0.242
3.08%
1 ene 1982 año
8.374
+0.254
3.13%
1 ene 1983 año
8.639
+0.265
3.17%
1 ene 1984 año
8.913
+0.274
3.17%
1 ene 1985 año
9.192
+0.279
3.14%
1 ene 1986 año
9.475
+0.282
3.07%
1 ene 1987 año
9.758
+0.284
2.99%
1 ene 1988 año
10.042
+0.284
2.91%
1 ene 1989 año
10.325
+0.283
2.82%
1 ene 1990 año
10.605
+0.28
2.71%
1 ene 1991 año
10.88
+0.275
2.59%
1 ene 1992 año
11.149
+0.27
2.48%
1 ene 1993 año
11.412
+0.263
2.36%
1 ene 1994 año
11.666
+0.254
2.23%
1 ene 1995 año
11.908
+0.242
2.07%
1 ene 1996 año
12.136
+0.228
1.91%
1 ene 1997 año
12.349
+0.213
1.76%
1 ene 1998 año
12.549
+0.2
1.62%
1 ene 1999 año
12.737
+0.189
1.5%
1 ene 2000 año
12.918
+0.18
1.42%
1 ene 2001 año
13.093
+0.175
1.36%
1 ene 2002 año
13.264
+0.171
1.3%
1 ene 2003 año
13.432
+0.168
1.27%
1 ene 2004 año
13.601
+0.17
1.26%
1 ene 2005 año
13.779
+0.177
1.3%
1 ene 2006 año
13.968
+0.189
1.37%
1 ene 2007 año
14.17
+0.202
1.45%
1 ene 2008 año
14.385
+0.215
1.52%
1 ene 2009 año
14.616
+0.231
1.6%
1 ene 2010 año
14.864
+0.248
1.7%
1 ene 2011 año
15.13
+0.266
1.79%
1 ene 2012 año
15.416
+0.286
1.89%
1 ene 2013 año
15.719
+0.303
1.97%
1 ene 2014 año
16.033
+0.314
1.99%
1 ene 2015 año
16.347
+0.314
1.96%
1 ene 2016 año
16.654
+0.307
1.88%
Ranking de los países por los datos estadísticos actuales


Comentarios: