29
/es/
es
AIzaSyAYiBZKx7MnpbEhh9jyipgxe19OcubqV5w
April 1, 2024
160118
Isle of Man
IMN
true
2
1
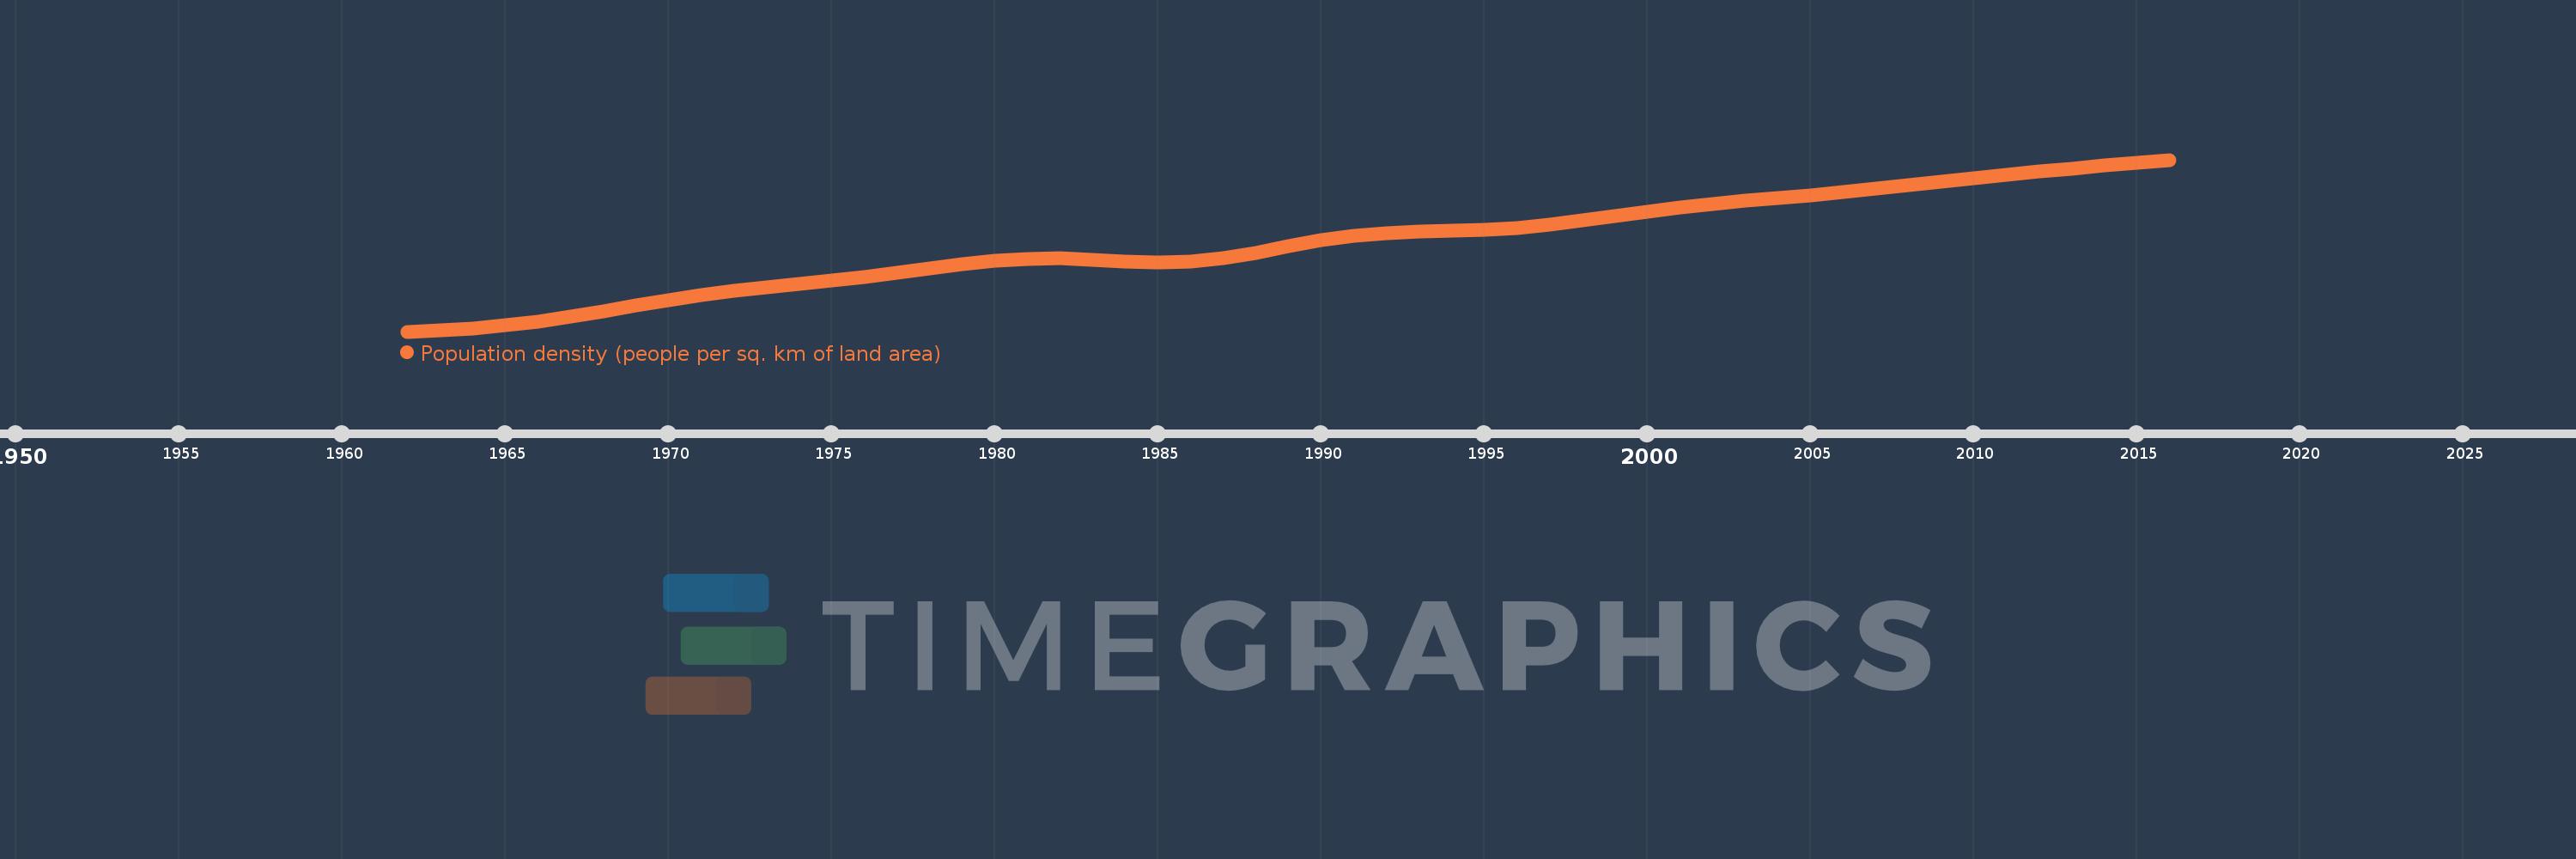
Population density (people per sq. km of land area)
2016,2015,2014,2013,2012,2011,2010,2009,2008,2007,2006,2005,2004,2003,2002,2001,2000,1999,1998,1997,1996,1995,1994,1993,1992,1991,1990,1989,1988,1987,1986,1985,1984,1983,1982,1981,1980,1979,1978,1977,1976,1975,1974,1973,1972,1971,1970,1969,1968,1967,1966,1965,1964,1963,1962
Estas estadísticas en otros países:
AfghanistanAlbaniaAlgeriaAmerican SamoaAndorraAngolaAntigua and BarbudaArab WorldArgentinaArmeniaArubaAustraliaAustriaAzerbaijanBahamas, TheBahrainBangladeshBarbadosBelarusBelgiumBelizeBeninBermudaBhutanBoliviaBosnia and HerzegovinaBotswanaBrazilBritish Virgin IslandsBrunei DarussalamBulgariaBurkina FasoBurundiCabo VerdeCambodiaCameroonCanadaCaribbean small statesCayman IslandsCentral African RepublicCentral Europe and the BalticsChadChannel IslandsChileChinaColombiaComorosCongo, Dem. Rep.Congo, Rep.Costa RicaCote d'IvoireCroatiaCubaCuracaoCyprusCzech RepublicDenmarkDjiboutiDominicaDominican RepublicEarly-demographic dividendEast Asia & PacificEast Asia & Pacific (excluding high income)East Asia & Pacific (IDA & IBRD countries)EcuadorEgypt, Arab Rep.El SalvadorEquatorial GuineaEritreaEstoniaEthiopiaEuro areaEurope & Central AsiaEurope & Central Asia (excluding high income)Europe & Central Asia (IDA & IBRD countries)European UnionFaroe IslandsFijiFinlandFragile and conflict affected situationsFranceFrench PolynesiaGabonGambia, TheGeorgiaGermanyGhanaGibraltarGreeceGreenlandGrenadaGuamGuatemalaGuineaGuinea-BissauGuyanaHaitiHeavily indebted poor countries (HIPC)High incomeHondurasHong Kong SAR, ChinaHungaryIBRD onlyIcelandIDA & IBRD totalIDA blendIDA onlyIDA totalIndiaIndonesiaIran, Islamic Rep.IraqIrelandIsle of ManIsraelItalyJamaicaJapanJordanKazakhstanKenyaKiribatiKorea, Dem. People’s Rep.Korea, Rep.KosovoKuwaitKyrgyz RepublicLao PDRLate-demographic dividendLatin America & Caribbean Latin America & Caribbean (excluding high income)Latin America & the Caribbean (IDA & IBRD countries)LatviaLeast developed countries: UN classificationLebanonLesothoLiberiaLibyaLiechtensteinLithuaniaLow & middle incomeLow incomeLower middle incomeLuxembourgMacao SAR, ChinaMacedonia, FYRMadagascarMalawiMalaysiaMaldivesMaliMaltaMarshall IslandsMauritaniaMauritiusMexicoMicronesia, Fed. Sts.Middle East & North AfricaMiddle East & North Africa (excluding high income)Middle East & North Africa (IDA & IBRD countries)Middle incomeMoldovaMonacoMongoliaMontenegroMoroccoMozambiqueMyanmarNamibiaNauruNepalNetherlandsNew CaledoniaNew ZealandNicaraguaNigerNigeriaNorth AmericaNorthern Mariana IslandsNorwayOECD membersOmanOther small statesPacific island small statesPakistanPalauPanamaPapua New GuineaParaguayPeruPhilippinesPolandPortugalPost-demographic dividendPre-demographic dividendPuerto RicoQatarRomaniaRussian FederationRwandaSamoaSan MarinoSao Tome and PrincipeSaudi ArabiaSenegalSerbiaSeychellesSierra LeoneSingaporeSint Maarten (Dutch part)Slovak RepublicSloveniaSmall statesSolomon IslandsSomaliaSouth AfricaSouth AsiaSouth Asia (IDA & IBRD)SpainSri LankaSt. Kitts and NevisSt. LuciaSt. Martin (French part)St. Vincent and the GrenadinesSub-Saharan Africa Sub-Saharan Africa (excluding high income)Sub-Saharan Africa (IDA & IBRD countries)SudanSurinameSwazilandSwedenSwitzerlandSyrian Arab RepublicTajikistanTanzaniaThailandTimor-LesteTogoTongaTrinidad and TobagoTunisiaTurkeyTurkmenistanTurks and Caicos IslandsTuvaluUgandaUkraineUnited Arab EmiratesUnited KingdomUnited StatesUpper middle incomeUruguayUzbekistanVanuatuVenezuela, RBVietnamVirgin Islands (U.S.)West Bank and GazaWorldYemen, Rep.ZambiaZimbabwe línea de tiempo (timeline):
En esta escala de tiempo se presenta un gráfico de 1962 y 2016 de Isle of Man. Los datos de 1961 están ausentes. El número de observaciones reales por fecha: 55.
Fuente (nombre):
Indicadores del desarrollo mundial
Fuente (organización):
Food and Agriculture Organization and World Bank population estimates.
Categorías:
Urban Development
Se ha actualizado:
23 abr 2017 año
Los indicadores de los cambios de valor en los últimos años
Mínimo:
84.83
1 ene 1962 año
Máximo:
154.0
1 ene 2016 año
A la fecha de observación
Valor
Cambio absoluto
El cambio con respecto al valor anterior
1 ene 1962 año
84.83
+84.83
0.0%
1 ene 1963 año
85.228
+0.398
0.47%
1 ene 1964 año
86.121
+0.893
1.05%
1 ene 1965 año
87.4
+1.279
1.49%
1 ene 1966 año
88.97
+1.57
1.8%
1 ene 1967 año
90.835
+1.865
2.1%
1 ene 1968 año
92.974
+2.139
2.35%
1 ene 1969 año
95.244
+2.27
2.44%
1 ene 1970 año
97.463
+2.219
2.33%
1 ene 1971 año
99.495
+2.032
2.08%
1 ene 1972 año
101.247
+1.753
1.76%
1 ene 1973 año
102.742
+1.495
1.48%
1 ene 1974 año
104.081
+1.339
1.3%
1 ene 1975 año
105.435
+1.354
1.3%
1 ene 1976 año
106.914
+1.479
1.4%
1 ene 1977 año
108.596
+1.682
1.57%
1 ene 1978 año
110.411
+1.814
1.67%
1 ene 1979 año
112.137
+1.726
1.56%
1 ene 1980 año
113.474
+1.337
1.19%
1 ene 1981 año
114.225
+0.751
0.66%
1 ene 1982 año
114.26
+0.035
0.03%
1 ene 1983 año
113.714
-0.546
-0.48%
1 ene 1984 año
112.989
-0.725
-0.64%
1 ene 1985 año
112.644
-0.346
-0.31%
1 ene 1986 año
113.063
+0.419
0.37%
1 ene 1987 año
114.43
+1.367
1.21%
1 ene 1988 año
116.577
+2.147
1.88%
1 ene 1989 año
119.126
+2.549
2.19%
1 ene 1990 año
121.518
+2.391
2.01%
1 ene 1991 año
123.354
+1.837
1.51%
1 ene 1992 año
124.496
+1.142
0.93%
1 ene 1993 año
125.098
+0.602
0.48%
1 ene 1994 año
125.414
+0.316
0.25%
1 ene 1995 año
125.835
+0.421
0.34%
1 ene 1996 año
126.633
+0.798
0.63%
1 ene 1997 año
127.893
+1.26
0.99%
1 ene 1998 año
129.504
+1.611
1.26%
1 ene 1999 año
131.321
+1.818
1.4%
1 ene 2000 año
133.121
+1.8
1.37%
1 ene 2001 año
134.747
+1.626
1.22%
1 ene 2002 año
136.154
+1.407
1.04%
1 ene 2003 año
137.4
+1.246
0.91%
1 ene 2004 año
138.553
+1.153
0.84%
1 ene 2005 año
139.712
+1.16
0.84%
1 ene 2006 año
140.956
+1.244
0.89%
1 ene 2007 año
142.298
+1.342
0.95%
1 ene 2008 año
143.709
+1.411
0.99%
1 ene 2009 año
145.153
+1.444
1.0%
1 ene 2010 año
146.575
+1.423
0.98%
1 ene 2011 año
147.942
+1.367
0.93%
1 ene 2012 año
149.244
+1.302
0.88%
1 ene 2013 año
150.489
+1.246
0.83%
1 ene 2014 año
151.688
+1.198
0.8%
1 ene 2015 año
152.854
+1.167
0.77%
1 ene 2016 año
154.0
+1.146
0.75%
Ranking de los países por los datos estadísticos actuales


Comentarios: