29
/es/
es
AIzaSyAYiBZKx7MnpbEhh9jyipgxe19OcubqV5w
April 1, 2024
149570
Haiti
HTI
true
2
1
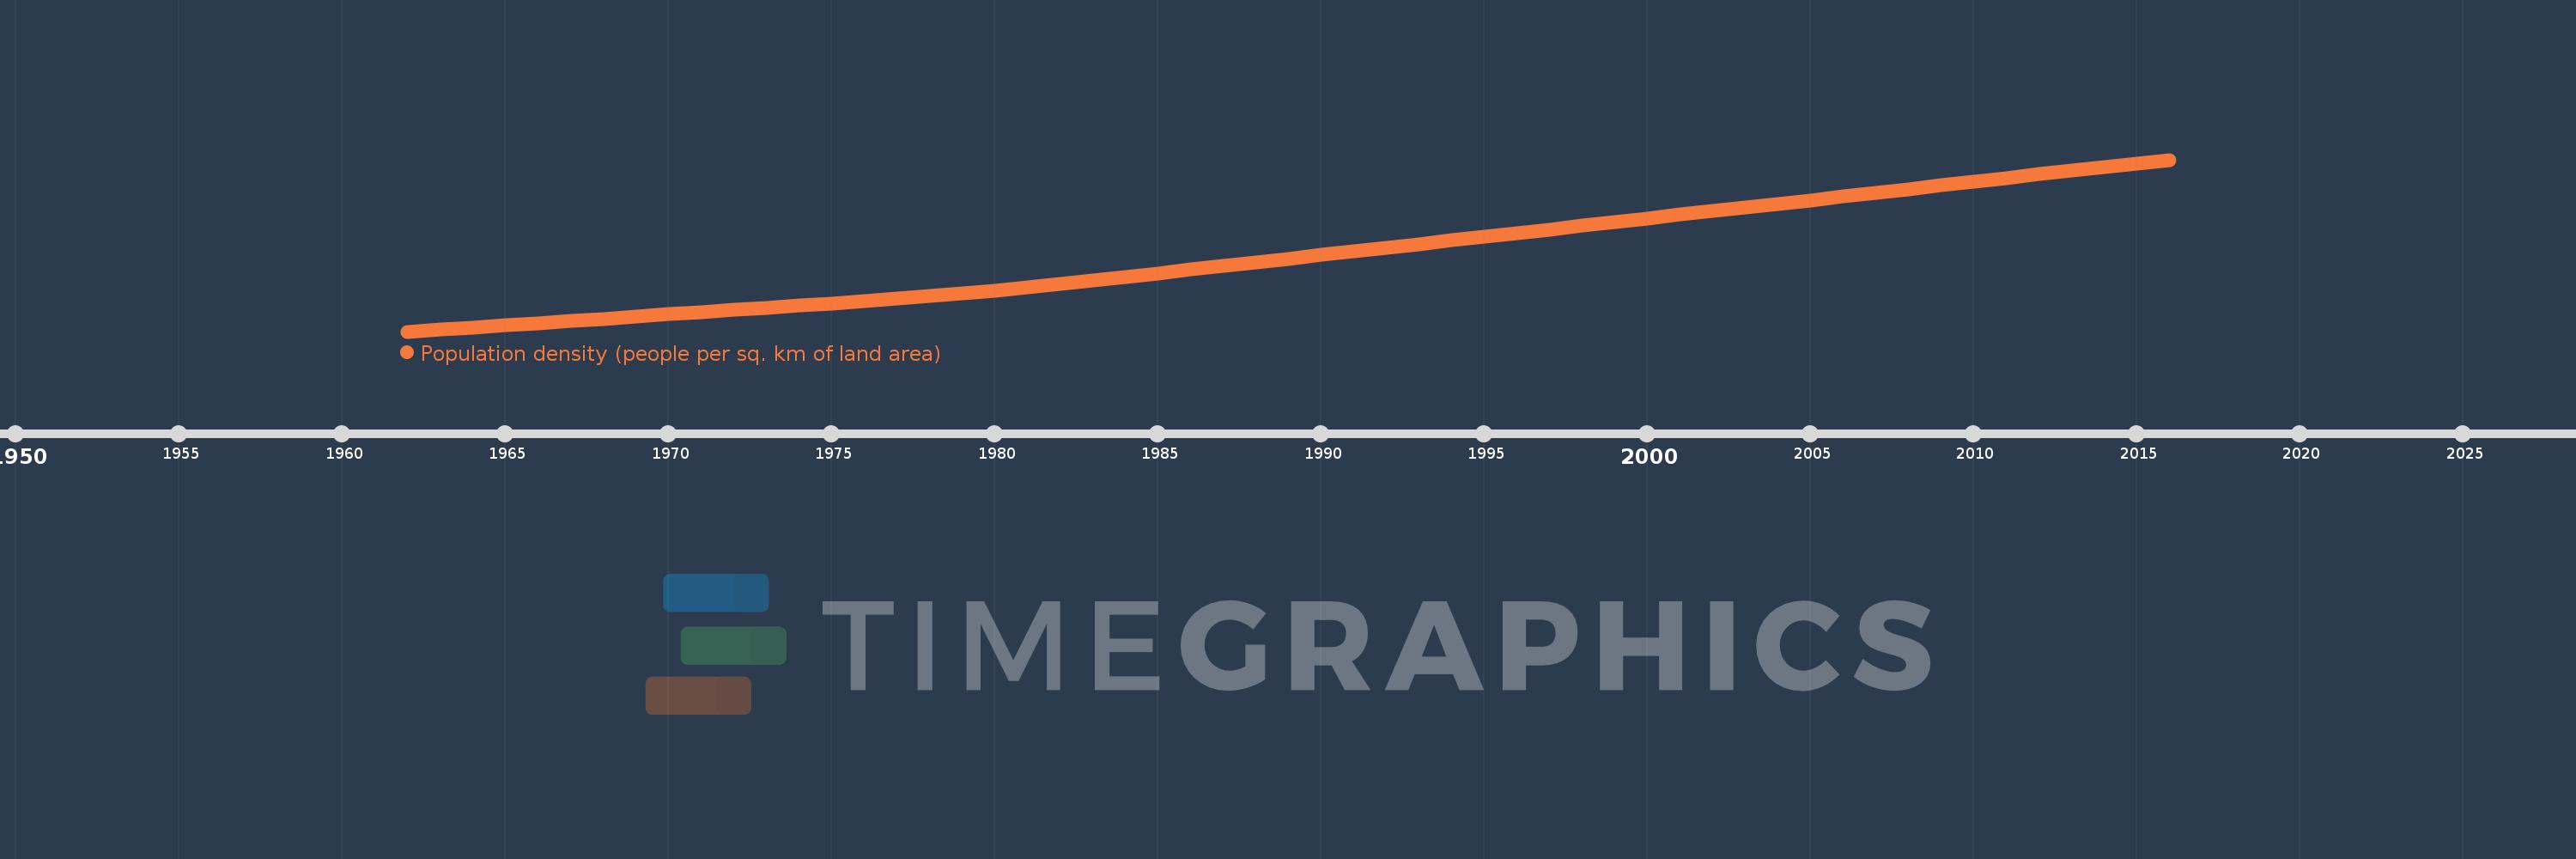
Population density (people per sq. km of land area)
2016,2015,2014,2013,2012,2011,2010,2009,2008,2007,2006,2005,2004,2003,2002,2001,2000,1999,1998,1997,1996,1995,1994,1993,1992,1991,1990,1989,1988,1987,1986,1985,1984,1983,1982,1981,1980,1979,1978,1977,1976,1975,1974,1973,1972,1971,1970,1969,1968,1967,1966,1965,1964,1963,1962
Estas estadísticas en otros países:
AfghanistanAlbaniaAlgeriaAmerican SamoaAndorraAngolaAntigua and BarbudaArab WorldArgentinaArmeniaArubaAustraliaAustriaAzerbaijanBahamas, TheBahrainBangladeshBarbadosBelarusBelgiumBelizeBeninBermudaBhutanBoliviaBosnia and HerzegovinaBotswanaBrazilBritish Virgin IslandsBrunei DarussalamBulgariaBurkina FasoBurundiCabo VerdeCambodiaCameroonCanadaCaribbean small statesCayman IslandsCentral African RepublicCentral Europe and the BalticsChadChannel IslandsChileChinaColombiaComorosCongo, Dem. Rep.Congo, Rep.Costa RicaCote d'IvoireCroatiaCubaCuracaoCyprusCzech RepublicDenmarkDjiboutiDominicaDominican RepublicEarly-demographic dividendEast Asia & PacificEast Asia & Pacific (excluding high income)East Asia & Pacific (IDA & IBRD countries)EcuadorEgypt, Arab Rep.El SalvadorEquatorial GuineaEritreaEstoniaEthiopiaEuro areaEurope & Central AsiaEurope & Central Asia (excluding high income)Europe & Central Asia (IDA & IBRD countries)European UnionFaroe IslandsFijiFinlandFragile and conflict affected situationsFranceFrench PolynesiaGabonGambia, TheGeorgiaGermanyGhanaGibraltarGreeceGreenlandGrenadaGuamGuatemalaGuineaGuinea-BissauGuyanaHaitiHeavily indebted poor countries (HIPC)High incomeHondurasHong Kong SAR, ChinaHungaryIBRD onlyIcelandIDA & IBRD totalIDA blendIDA onlyIDA totalIndiaIndonesiaIran, Islamic Rep.IraqIrelandIsle of ManIsraelItalyJamaicaJapanJordanKazakhstanKenyaKiribatiKorea, Dem. People’s Rep.Korea, Rep.KosovoKuwaitKyrgyz RepublicLao PDRLate-demographic dividendLatin America & Caribbean Latin America & Caribbean (excluding high income)Latin America & the Caribbean (IDA & IBRD countries)LatviaLeast developed countries: UN classificationLebanonLesothoLiberiaLibyaLiechtensteinLithuaniaLow & middle incomeLow incomeLower middle incomeLuxembourgMacao SAR, ChinaMacedonia, FYRMadagascarMalawiMalaysiaMaldivesMaliMaltaMarshall IslandsMauritaniaMauritiusMexicoMicronesia, Fed. Sts.Middle East & North AfricaMiddle East & North Africa (excluding high income)Middle East & North Africa (IDA & IBRD countries)Middle incomeMoldovaMonacoMongoliaMontenegroMoroccoMozambiqueMyanmarNamibiaNauruNepalNetherlandsNew CaledoniaNew ZealandNicaraguaNigerNigeriaNorth AmericaNorthern Mariana IslandsNorwayOECD membersOmanOther small statesPacific island small statesPakistanPalauPanamaPapua New GuineaParaguayPeruPhilippinesPolandPortugalPost-demographic dividendPre-demographic dividendPuerto RicoQatarRomaniaRussian FederationRwandaSamoaSan MarinoSao Tome and PrincipeSaudi ArabiaSenegalSerbiaSeychellesSierra LeoneSingaporeSint Maarten (Dutch part)Slovak RepublicSloveniaSmall statesSolomon IslandsSomaliaSouth AfricaSouth AsiaSouth Asia (IDA & IBRD)SpainSri LankaSt. Kitts and NevisSt. LuciaSt. Martin (French part)St. Vincent and the GrenadinesSub-Saharan Africa Sub-Saharan Africa (excluding high income)Sub-Saharan Africa (IDA & IBRD countries)SudanSurinameSwazilandSwedenSwitzerlandSyrian Arab RepublicTajikistanTanzaniaThailandTimor-LesteTogoTongaTrinidad and TobagoTunisiaTurkeyTurkmenistanTurks and Caicos IslandsTuvaluUgandaUkraineUnited Arab EmiratesUnited KingdomUnited StatesUpper middle incomeUruguayUzbekistanVanuatuVenezuela, RBVietnamVirgin Islands (U.S.)West Bank and GazaWorldYemen, Rep.ZambiaZimbabwe línea de tiempo (timeline):
En esta escala de tiempo se presenta un gráfico de 1962 y 2016 de Haiti. Los datos de 1961 están ausentes. El número de observaciones reales por fecha: 55.
Fuente (nombre):
Indicadores del desarrollo mundial
Fuente (organización):
Food and Agriculture Organization and World Bank population estimates.
Categorías:
Urban Development
Se ha actualizado:
23 abr 2017 año
Los indicadores de los cambios de valor en los últimos años
Mínimo:
143.083
1 ene 1962 año
Máximo:
388.645
1 ene 2016 año
A la fecha de observación
Valor
Cambio absoluto
El cambio con respecto al valor anterior
1 ene 1962 año
143.083
+143.083
0.0%
1 ene 1963 año
145.958
+2.875
2.01%
1 ene 1964 año
148.902
+2.944
2.02%
1 ene 1965 año
151.91
+3.008
2.02%
1 ene 1966 año
154.976
+3.066
2.02%
1 ene 1967 año
158.109
+3.133
2.02%
1 ene 1968 año
161.304
+3.195
2.02%
1 ene 1969 año
164.522
+3.219
2.0%
1 ene 1970 año
167.714
+3.192
1.94%
1 ene 1971 año
170.85
+3.136
1.87%
1 ene 1972 año
173.917
+3.067
1.79%
1 ene 1973 año
176.943
+3.026
1.74%
1 ene 1974 año
179.995
+3.051
1.72%
1 ene 1975 año
183.162
+3.167
1.76%
1 ene 1976 año
186.515
+3.353
1.83%
1 ene 1977 año
190.067
+3.552
1.9%
1 ene 1978 año
193.811
+3.744
1.97%
1 ene 1979 año
197.77
+3.96
2.04%
1 ene 1980 año
201.969
+4.199
2.12%
1 ene 1981 año
206.416
+4.447
2.2%
1 ene 1982 año
211.127
+4.711
2.28%
1 ene 1983 año
216.084
+4.956
2.35%
1 ene 1984 año
221.215
+5.132
2.37%
1 ene 1985 año
226.427
+5.212
2.36%
1 ene 1986 año
231.647
+5.22
2.31%
1 ene 1987 año
236.849
+5.201
2.25%
1 ene 1988 año
242.038
+5.189
2.19%
1 ene 1989 año
247.219
+5.181
2.14%
1 ene 1990 año
252.406
+5.187
2.1%
1 ene 1991 año
257.61
+5.204
2.06%
1 ene 1992 año
262.823
+5.213
2.02%
1 ene 1993 año
268.032
+5.21
1.98%
1 ene 1994 año
273.248
+5.215
1.95%
1 ene 1995 año
278.48
+5.233
1.91%
1 ene 1996 año
283.738
+5.257
1.89%
1 ene 1997 año
289.026
+5.288
1.86%
1 ene 1998 año
294.338
+5.312
1.84%
1 ene 1999 año
299.655
+5.317
1.81%
1 ene 2000 año
304.949
+5.294
1.77%
1 ene 2001 año
310.203
+5.254
1.72%
1 ene 2002 año
315.405
+5.202
1.68%
1 ene 2003 año
320.564
+5.159
1.64%
1 ene 2004 año
325.71
+5.146
1.61%
1 ene 2005 año
330.885
+5.175
1.59%
1 ene 2006 año
336.118
+5.233
1.58%
1 ene 2007 año
341.418
+5.3
1.58%
1 ene 2008 año
346.769
+5.351
1.57%
1 ene 2009 año
352.146
+5.376
1.55%
1 ene 2010 año
357.509
+5.364
1.52%
1 ene 2011 año
362.831
+5.322
1.49%
1 ene 2012 año
368.102
+5.271
1.45%
1 ene 2013 año
373.325
+5.223
1.42%
1 ene 2014 año
378.492
+5.168
1.38%
1 ene 2015 año
383.6
+5.108
1.35%
1 ene 2016 año
388.645
+5.045
1.32%
Ranking de los países por los datos estadísticos actuales


Comentarios: