29
/fr/
fr
AIzaSyAYiBZKx7MnpbEhh9jyipgxe19OcubqV5w
April 1, 2024
126699
El Salvador
SLV
true
2
1
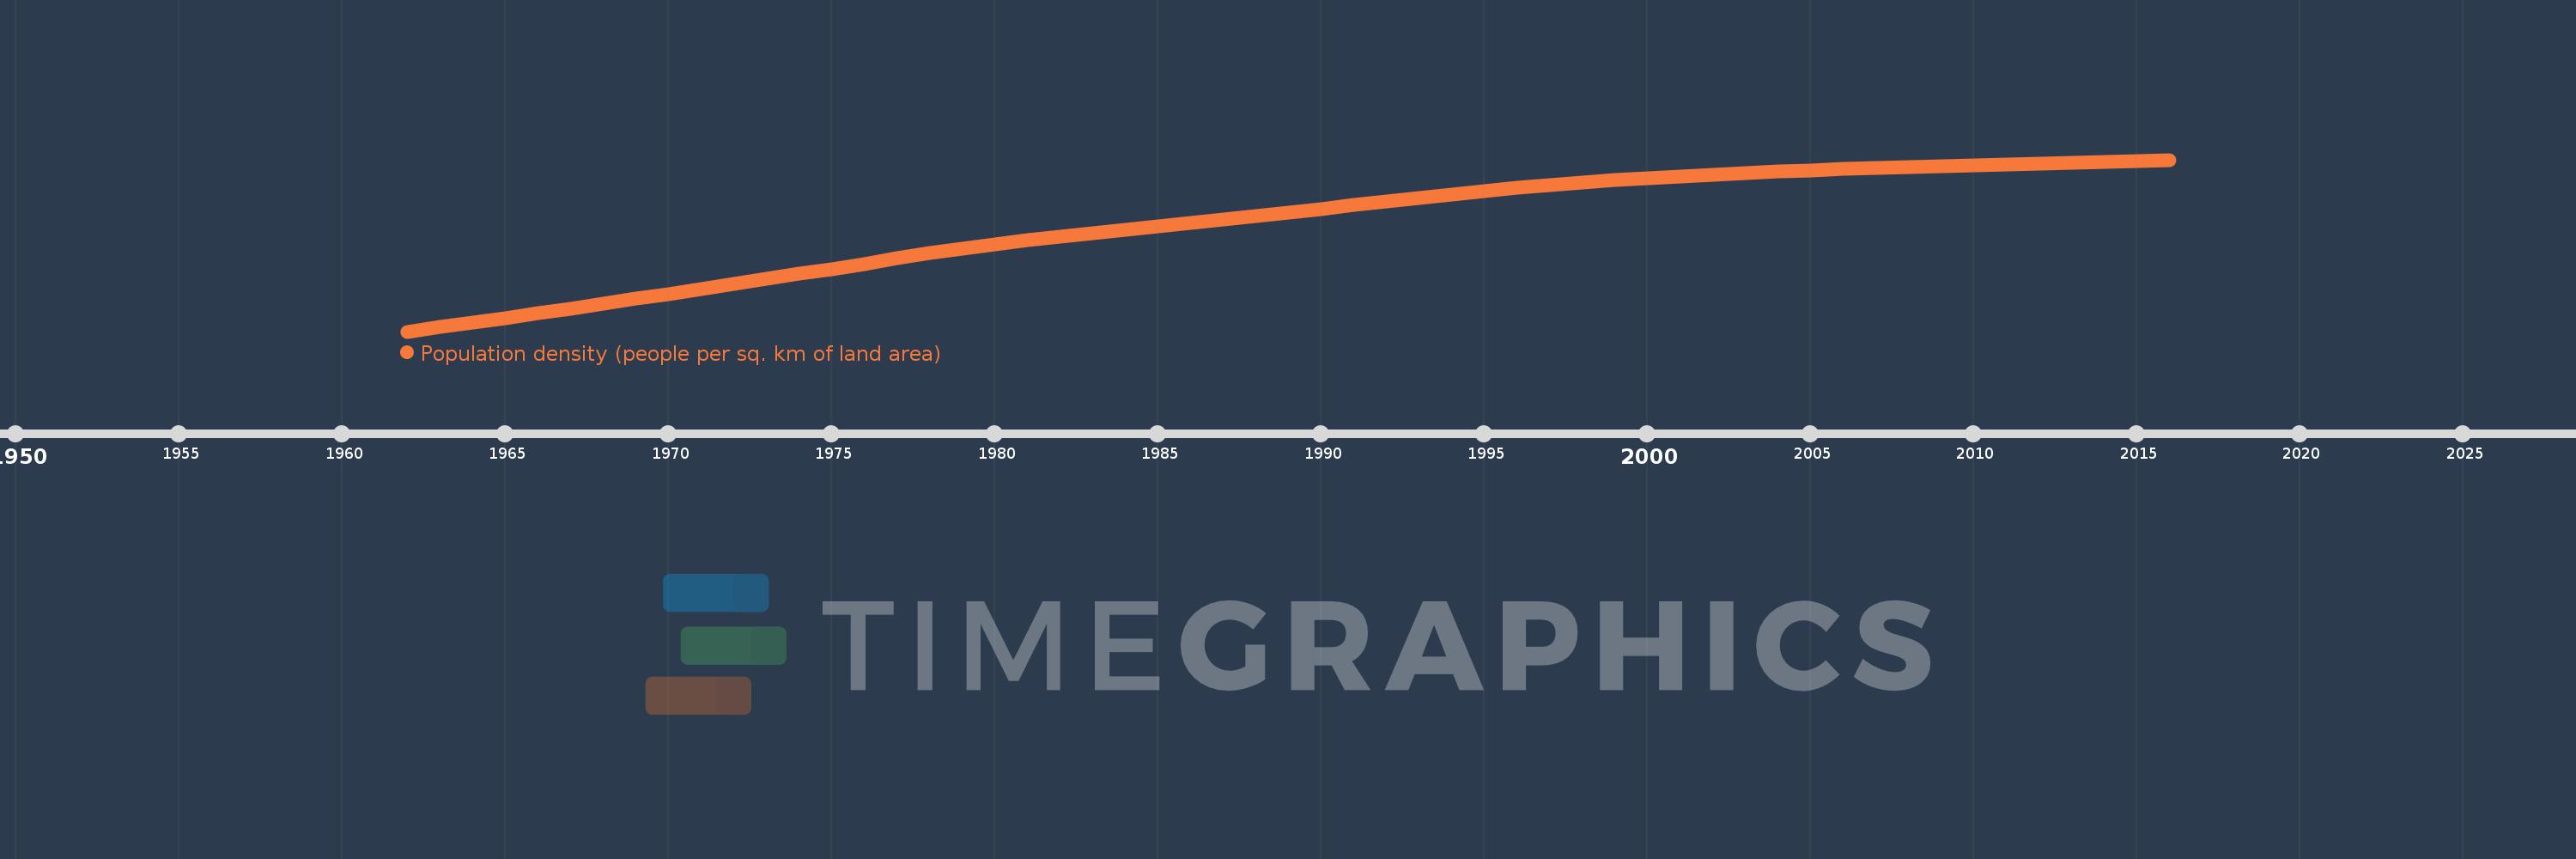
Population density (people per sq. km of land area)
2016,2015,2014,2013,2012,2011,2010,2009,2008,2007,2006,2005,2004,2003,2002,2001,2000,1999,1998,1997,1996,1995,1994,1993,1992,1991,1990,1989,1988,1987,1986,1985,1984,1983,1982,1981,1980,1979,1978,1977,1976,1975,1974,1973,1972,1971,1970,1969,1968,1967,1966,1965,1964,1963,1962
Cette statistique dans les autres pays:
AfghanistanAlbaniaAlgeriaAmerican SamoaAndorraAngolaAntigua and BarbudaArab WorldArgentinaArmeniaArubaAustraliaAustriaAzerbaijanBahamas, TheBahrainBangladeshBarbadosBelarusBelgiumBelizeBeninBermudaBhutanBoliviaBosnia and HerzegovinaBotswanaBrazilBritish Virgin IslandsBrunei DarussalamBulgariaBurkina FasoBurundiCabo VerdeCambodiaCameroonCanadaCaribbean small statesCayman IslandsCentral African RepublicCentral Europe and the BalticsChadChannel IslandsChileChinaColombiaComorosCongo, Dem. Rep.Congo, Rep.Costa RicaCote d'IvoireCroatiaCubaCuracaoCyprusCzech RepublicDenmarkDjiboutiDominicaDominican RepublicEarly-demographic dividendEast Asia & PacificEast Asia & Pacific (excluding high income)East Asia & Pacific (IDA & IBRD countries)EcuadorEgypt, Arab Rep.El SalvadorEquatorial GuineaEritreaEstoniaEthiopiaEuro areaEurope & Central AsiaEurope & Central Asia (excluding high income)Europe & Central Asia (IDA & IBRD countries)European UnionFaroe IslandsFijiFinlandFragile and conflict affected situationsFranceFrench PolynesiaGabonGambia, TheGeorgiaGermanyGhanaGibraltarGreeceGreenlandGrenadaGuamGuatemalaGuineaGuinea-BissauGuyanaHaitiHeavily indebted poor countries (HIPC)High incomeHondurasHong Kong SAR, ChinaHungaryIBRD onlyIcelandIDA & IBRD totalIDA blendIDA onlyIDA totalIndiaIndonesiaIran, Islamic Rep.IraqIrelandIsle of ManIsraelItalyJamaicaJapanJordanKazakhstanKenyaKiribatiKorea, Dem. People’s Rep.Korea, Rep.KosovoKuwaitKyrgyz RepublicLao PDRLate-demographic dividendLatin America & Caribbean Latin America & Caribbean (excluding high income)Latin America & the Caribbean (IDA & IBRD countries)LatviaLeast developed countries: UN classificationLebanonLesothoLiberiaLibyaLiechtensteinLithuaniaLow & middle incomeLow incomeLower middle incomeLuxembourgMacao SAR, ChinaMacedonia, FYRMadagascarMalawiMalaysiaMaldivesMaliMaltaMarshall IslandsMauritaniaMauritiusMexicoMicronesia, Fed. Sts.Middle East & North AfricaMiddle East & North Africa (excluding high income)Middle East & North Africa (IDA & IBRD countries)Middle incomeMoldovaMonacoMongoliaMontenegroMoroccoMozambiqueMyanmarNamibiaNauruNepalNetherlandsNew CaledoniaNew ZealandNicaraguaNigerNigeriaNorth AmericaNorthern Mariana IslandsNorwayOECD membersOmanOther small statesPacific island small statesPakistanPalauPanamaPapua New GuineaParaguayPeruPhilippinesPolandPortugalPost-demographic dividendPre-demographic dividendPuerto RicoQatarRomaniaRussian FederationRwandaSamoaSan MarinoSao Tome and PrincipeSaudi ArabiaSenegalSerbiaSeychellesSierra LeoneSingaporeSint Maarten (Dutch part)Slovak RepublicSloveniaSmall statesSolomon IslandsSomaliaSouth AfricaSouth AsiaSouth Asia (IDA & IBRD)SpainSri LankaSt. Kitts and NevisSt. LuciaSt. Martin (French part)St. Vincent and the GrenadinesSub-Saharan Africa Sub-Saharan Africa (excluding high income)Sub-Saharan Africa (IDA & IBRD countries)SudanSurinameSwazilandSwedenSwitzerlandSyrian Arab RepublicTajikistanTanzaniaThailandTimor-LesteTogoTongaTrinidad and TobagoTunisiaTurkeyTurkmenistanTurks and Caicos IslandsTuvaluUgandaUkraineUnited Arab EmiratesUnited KingdomUnited StatesUpper middle incomeUruguayUzbekistanVanuatuVenezuela, RBVietnamVirgin Islands (U.S.)West Bank and GazaWorldYemen, Rep.ZambiaZimbabwe La ligne de temps
Cette échelle de temps montre un graphique de 1962 année à 2016 année El Salvador. Les données jusqu'à 1961 année ne sont pas présentés. Quantité d'observations actuelles selon dates: 55.
Source (désignation):
Les indicateurs du développement mondiale
Source (organisation):
Food and Agriculture Organization and World Bank population estimates.
Catégories:
Urban Development
Dernière mise à jour
23 avr. 2017
Les indicateurs de changement de valeurs selon les années
Minimum:
136.367
1 janv. 1962
Maximum:
295.685
1 janv. 2016
Pour la date d''observation
Valeur
Changement absolu
Le changement par rapport à la valeur précédente
1 janv. 1962
136.367
+136.367
0.0%
1 janv. 1963
140.425
+4.058
2.98%
1 janv. 1964
144.647
+4.222
3.01%
1 janv. 1965
148.978
+4.331
2.99%
1 janv. 1966
153.375
+4.397
2.95%
1 janv. 1967
157.813
+4.438
2.89%
1 janv. 1968
162.287
+4.474
2.83%
1 janv. 1969
166.796
+4.51
2.78%
1 janv. 1970
171.351
+4.555
2.73%
1 janv. 1971
175.952
+4.601
2.68%
1 janv. 1972
180.588
+4.636
2.63%
1 janv. 1973
185.234
+4.647
2.57%
1 janv. 1974
189.862
+4.628
2.5%
1 janv. 1975
194.434
+4.573
2.41%
1 janv. 1976
198.922
+4.488
2.31%
1 janv. 1977
204.595
+5.673
2.85%
1 janv. 1978
208.92
+4.325
2.11%
1 janv. 1979
213.109
+4.19
2.01%
1 janv. 1980
217.121
+4.012
1.88%
1 janv. 1981
220.931
+3.809
1.75%
1 janv. 1982
224.52
+3.59
1.62%
1 janv. 1983
227.909
+3.389
1.51%
1 janv. 1984
231.152
+3.243
1.42%
1 janv. 1985
234.328
+3.176
1.37%
1 janv. 1986
237.497
+3.169
1.35%
1 janv. 1987
240.663
+3.166
1.33%
1 janv. 1988
243.817
+3.154
1.31%
1 janv. 1989
246.987
+3.17
1.3%
1 janv. 1990
250.204
+3.216
1.3%
1 janv. 1991
253.479
+3.275
1.31%
1 janv. 1992
256.833
+3.354
1.32%
1 janv. 1993
260.239
+3.406
1.33%
1 janv. 1994
263.602
+3.364
1.29%
1 janv. 1995
266.796
+3.194
1.21%
1 janv. 1996
269.727
+2.931
1.1%
1 janv. 1997
272.363
+2.636
0.98%
1 janv. 1998
274.725
+2.362
0.87%
1 janv. 1999
276.838
+2.113
0.77%
1 janv. 2000
278.748
+1.91
0.69%
1 janv. 2001
280.494
+1.746
0.63%
1 janv. 2002
282.082
+1.588
0.57%
1 janv. 2003
283.509
+1.427
0.51%
1 janv. 2004
284.794
+1.285
0.45%
1 janv. 2005
285.96
+1.166
0.41%
1 janv. 2006
287.027
+1.067
0.37%
1 janv. 2007
288.009
+0.982
0.34%
1 janv. 2008
288.92
+0.91
0.32%
1 janv. 2009
289.778
+0.858
0.3%
1 janv. 2010
290.607
+0.829
0.29%
1 janv. 2011
291.424
+0.817
0.28%
1 janv. 2012
292.24
+0.816
0.28%
1 janv. 2013
293.061
+0.822
0.28%
1 janv. 2014
293.902
+0.84
0.29%
1 janv. 2015
294.773
+0.872
0.3%
1 janv. 2016
295.685
+0.911
0.31%
Classement des pays selon les statistiques actuelles par années


Commentaires: