29
/fr/
fr
AIzaSyAYiBZKx7MnpbEhh9jyipgxe19OcubqV5w
April 1, 2024
198059
Moldova
MDA
true
2
1
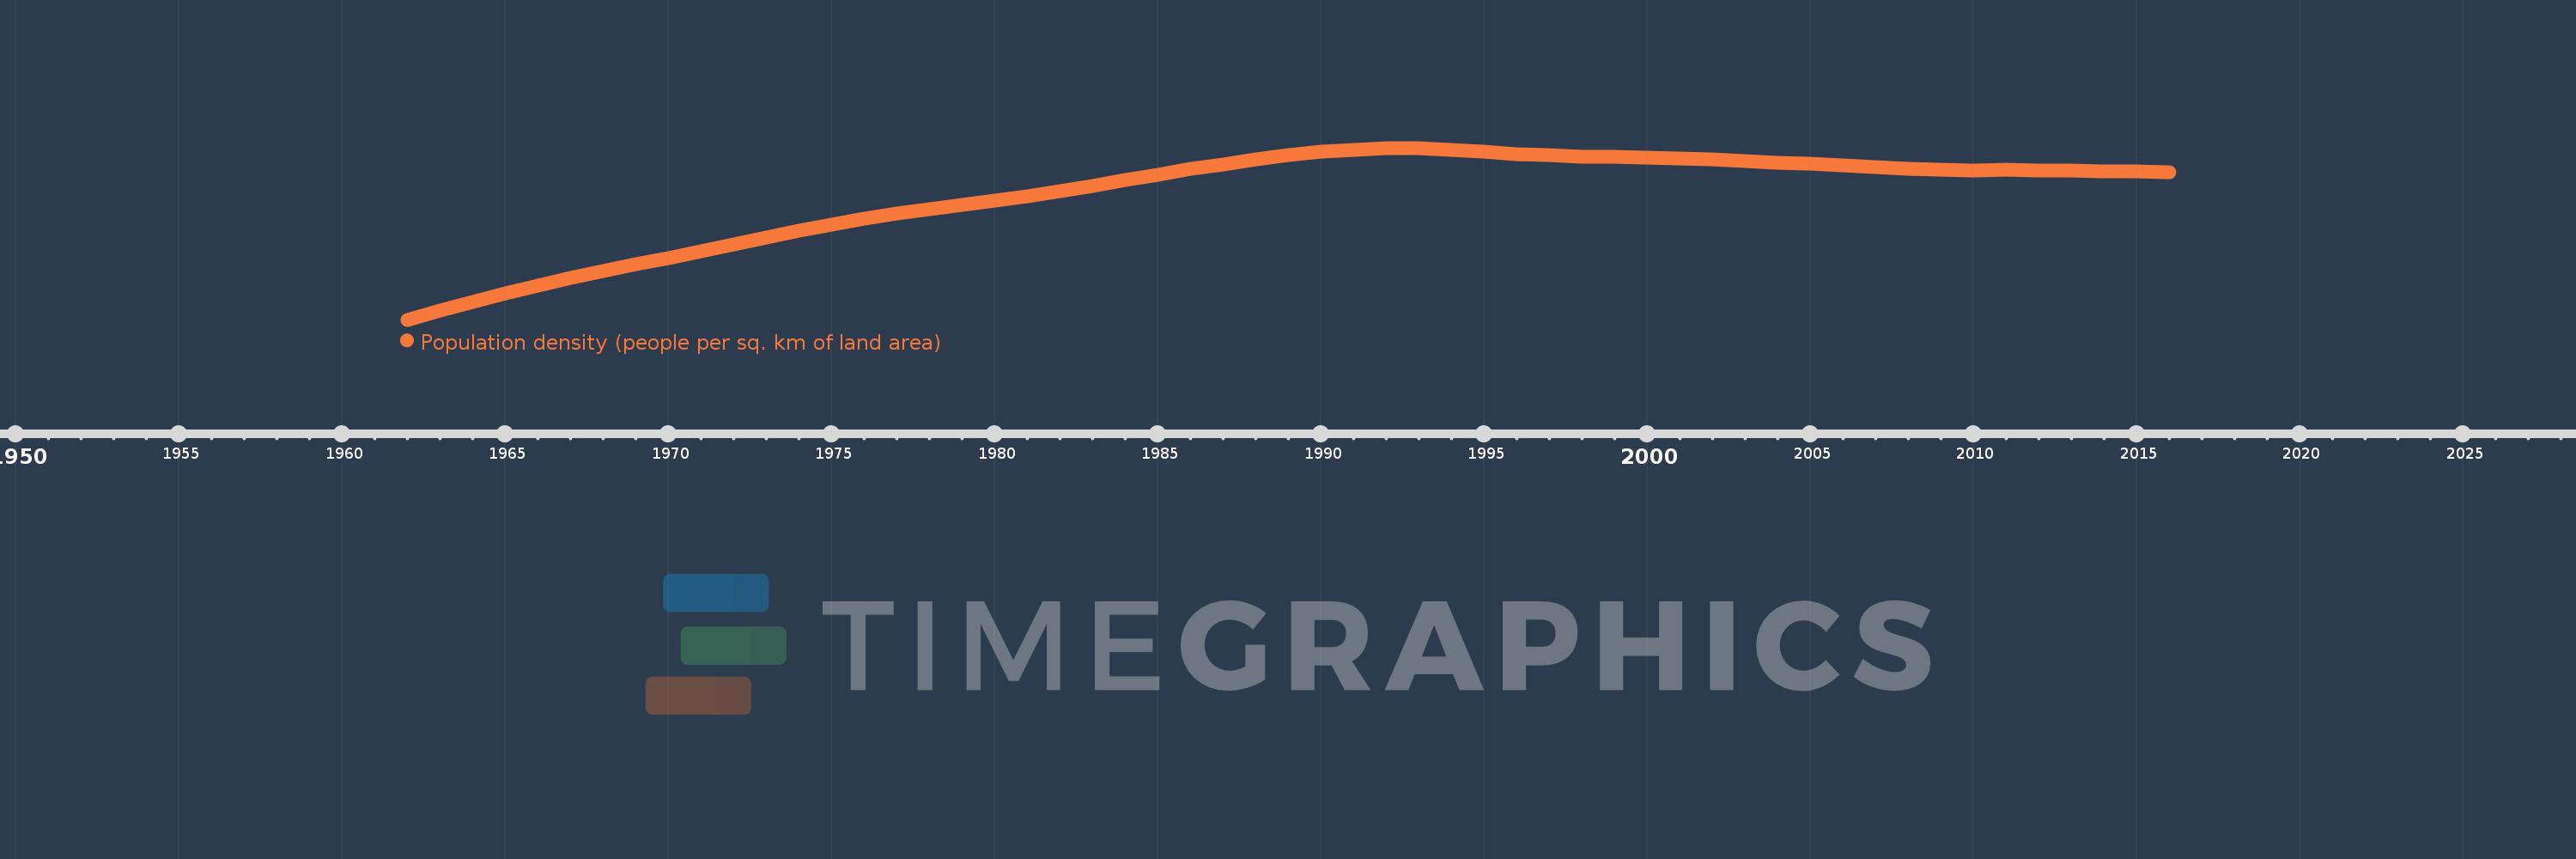
Population density (people per sq. km of land area)
2016,2015,2014,2013,2012,2011,2010,2009,2008,2007,2006,2005,2004,2003,2002,2001,2000,1999,1998,1997,1996,1995,1994,1993,1992,1991,1990,1989,1988,1987,1986,1985,1984,1983,1982,1981,1980,1979,1978,1977,1976,1975,1974,1973,1972,1971,1970,1969,1968,1967,1966,1965,1964,1963,1962
Cette statistique dans les autres pays:
AfghanistanAlbaniaAlgeriaAmerican SamoaAndorraAngolaAntigua and BarbudaArab WorldArgentinaArmeniaArubaAustraliaAustriaAzerbaijanBahamas, TheBahrainBangladeshBarbadosBelarusBelgiumBelizeBeninBermudaBhutanBoliviaBosnia and HerzegovinaBotswanaBrazilBritish Virgin IslandsBrunei DarussalamBulgariaBurkina FasoBurundiCabo VerdeCambodiaCameroonCanadaCaribbean small statesCayman IslandsCentral African RepublicCentral Europe and the BalticsChadChannel IslandsChileChinaColombiaComorosCongo, Dem. Rep.Congo, Rep.Costa RicaCote d'IvoireCroatiaCubaCuracaoCyprusCzech RepublicDenmarkDjiboutiDominicaDominican RepublicEarly-demographic dividendEast Asia & PacificEast Asia & Pacific (excluding high income)East Asia & Pacific (IDA & IBRD countries)EcuadorEgypt, Arab Rep.El SalvadorEquatorial GuineaEritreaEstoniaEthiopiaEuro areaEurope & Central AsiaEurope & Central Asia (excluding high income)Europe & Central Asia (IDA & IBRD countries)European UnionFaroe IslandsFijiFinlandFragile and conflict affected situationsFranceFrench PolynesiaGabonGambia, TheGeorgiaGermanyGhanaGibraltarGreeceGreenlandGrenadaGuamGuatemalaGuineaGuinea-BissauGuyanaHaitiHeavily indebted poor countries (HIPC)High incomeHondurasHong Kong SAR, ChinaHungaryIBRD onlyIcelandIDA & IBRD totalIDA blendIDA onlyIDA totalIndiaIndonesiaIran, Islamic Rep.IraqIrelandIsle of ManIsraelItalyJamaicaJapanJordanKazakhstanKenyaKiribatiKorea, Dem. People’s Rep.Korea, Rep.KosovoKuwaitKyrgyz RepublicLao PDRLate-demographic dividendLatin America & Caribbean Latin America & Caribbean (excluding high income)Latin America & the Caribbean (IDA & IBRD countries)LatviaLeast developed countries: UN classificationLebanonLesothoLiberiaLibyaLiechtensteinLithuaniaLow & middle incomeLow incomeLower middle incomeLuxembourgMacao SAR, ChinaMacedonia, FYRMadagascarMalawiMalaysiaMaldivesMaliMaltaMarshall IslandsMauritaniaMauritiusMexicoMicronesia, Fed. Sts.Middle East & North AfricaMiddle East & North Africa (excluding high income)Middle East & North Africa (IDA & IBRD countries)Middle incomeMoldovaMonacoMongoliaMontenegroMoroccoMozambiqueMyanmarNamibiaNauruNepalNetherlandsNew CaledoniaNew ZealandNicaraguaNigerNigeriaNorth AmericaNorthern Mariana IslandsNorwayOECD membersOmanOther small statesPacific island small statesPakistanPalauPanamaPapua New GuineaParaguayPeruPhilippinesPolandPortugalPost-demographic dividendPre-demographic dividendPuerto RicoQatarRomaniaRussian FederationRwandaSamoaSan MarinoSao Tome and PrincipeSaudi ArabiaSenegalSerbiaSeychellesSierra LeoneSingaporeSint Maarten (Dutch part)Slovak RepublicSloveniaSmall statesSolomon IslandsSomaliaSouth AfricaSouth AsiaSouth Asia (IDA & IBRD)SpainSri LankaSt. Kitts and NevisSt. LuciaSt. Martin (French part)St. Vincent and the GrenadinesSub-Saharan Africa Sub-Saharan Africa (excluding high income)Sub-Saharan Africa (IDA & IBRD countries)SudanSurinameSwazilandSwedenSwitzerlandSyrian Arab RepublicTajikistanTanzaniaThailandTimor-LesteTogoTongaTrinidad and TobagoTunisiaTurkeyTurkmenistanTurks and Caicos IslandsTuvaluUgandaUkraineUnited Arab EmiratesUnited KingdomUnited StatesUpper middle incomeUruguayUzbekistanVanuatuVenezuela, RBVietnamVirgin Islands (U.S.)West Bank and GazaWorldYemen, Rep.ZambiaZimbabwe La ligne de temps
Cette échelle de temps montre un graphique de 1962 année à 2016 année Moldova. Les données jusqu'à 1961 année ne sont pas présentés. Quantité d'observations actuelles selon dates: 55.
Source (désignation):
Les indicateurs du développement mondiale
Source (organisation):
Food and Agriculture Organization and World Bank population estimates.
Catégories:
Urban Development
Dernière mise à jour
23 avr. 2017
Les indicateurs de changement de valeurs selon les années
Minimum:
90.744
1 janv. 1962
Maximum:
129.097
1 janv. 1993
Pour la date d''observation
Valeur
Changement absolu
Le changement par rapport à la valeur précédente
1 janv. 1962
90.744
+90.744
0.0%
1 janv. 1963
92.8
+2.055
2.26%
1 janv. 1964
94.785
+1.986
2.14%
1 janv. 1965
96.631
+1.846
1.95%
1 janv. 1966
98.408
+1.777
1.84%
1 janv. 1967
100.08
+1.672
1.7%
1 janv. 1968
101.648
+1.568
1.57%
1 janv. 1969
103.111
+1.463
1.44%
1 janv. 1970
104.574
+1.463
1.42%
1 janv. 1971
106.037
+1.463
1.4%
1 janv. 1972
107.57
+1.533
1.45%
1 janv. 1973
109.067
+1.498
1.39%
1 janv. 1974
110.565
+1.498
1.37%
1 janv. 1975
111.994
+1.428
1.29%
1 janv. 1976
113.248
+1.254
1.12%
1 janv. 1977
114.397
+1.15
1.02%
1 janv. 1978
115.373
+0.975
0.85%
1 janv. 1979
116.313
+0.941
0.82%
1 janv. 1980
117.254
+0.941
0.81%
1 janv. 1981
118.299
+1.045
0.89%
1 janv. 1982
119.448
+1.15
0.97%
1 janv. 1983
120.667
+1.219
1.02%
1 janv. 1984
121.921
+1.254
1.04%
1 janv. 1985
123.176
+1.254
1.03%
1 janv. 1986
124.36
+1.184
0.96%
1 janv. 1987
125.475
+1.115
0.9%
1 janv. 1988
126.554
+1.08
0.86%
1 janv. 1989
127.495
+0.941
0.74%
1 janv. 1990
128.227
+0.732
0.57%
1 janv. 1991
128.749
+0.523
0.41%
1 janv. 1992
129.028
+0.279
0.22%
1 janv. 1993
129.097
+0.07
0.05%
1 janv. 1994
128.565
-0.532
-0.41%
1 janv. 1995
128.262
-0.303
-0.24%
1 janv. 1996
127.754
-0.508
-0.4%
1 janv. 1997
127.498
-0.256
-0.2%
1 janv. 1998
127.072
-0.427
-0.33%
1 janv. 1999
127.065
-0.007
-0.01%
1 janv. 2000
126.91
-0.155
-0.12%
1 janv. 2001
126.74
-0.17
-0.13%
1 janv. 2002
126.457
-0.283
-0.22%
1 janv. 2003
126.164
-0.293
-0.23%
1 janv. 2004
125.853
-0.311
-0.25%
1 janv. 2005
125.499
-0.355
-0.28%
1 janv. 2006
125.15
-0.349
-0.28%
1 janv. 2007
124.803
-0.347
-0.28%
1 janv. 2008
124.514
-0.289
-0.23%
1 janv. 2009
124.277
-0.237
-0.19%
1 janv. 2010
124.12
-0.157
-0.13%
1 janv. 2011
124.169
+0.049
0.04%
1 janv. 2012
124.098
-0.072
-0.06%
1 janv. 2013
124.038
-0.06
-0.05%
1 janv. 2014
123.918
-0.12
-0.1%
1 janv. 2015
123.843
-0.076
-0.06%
1 janv. 2016
123.765
-0.078
-0.06%
Classement des pays selon les statistiques actuelles par années


Commentaires: