Download This statistics in other country:
Timeline:
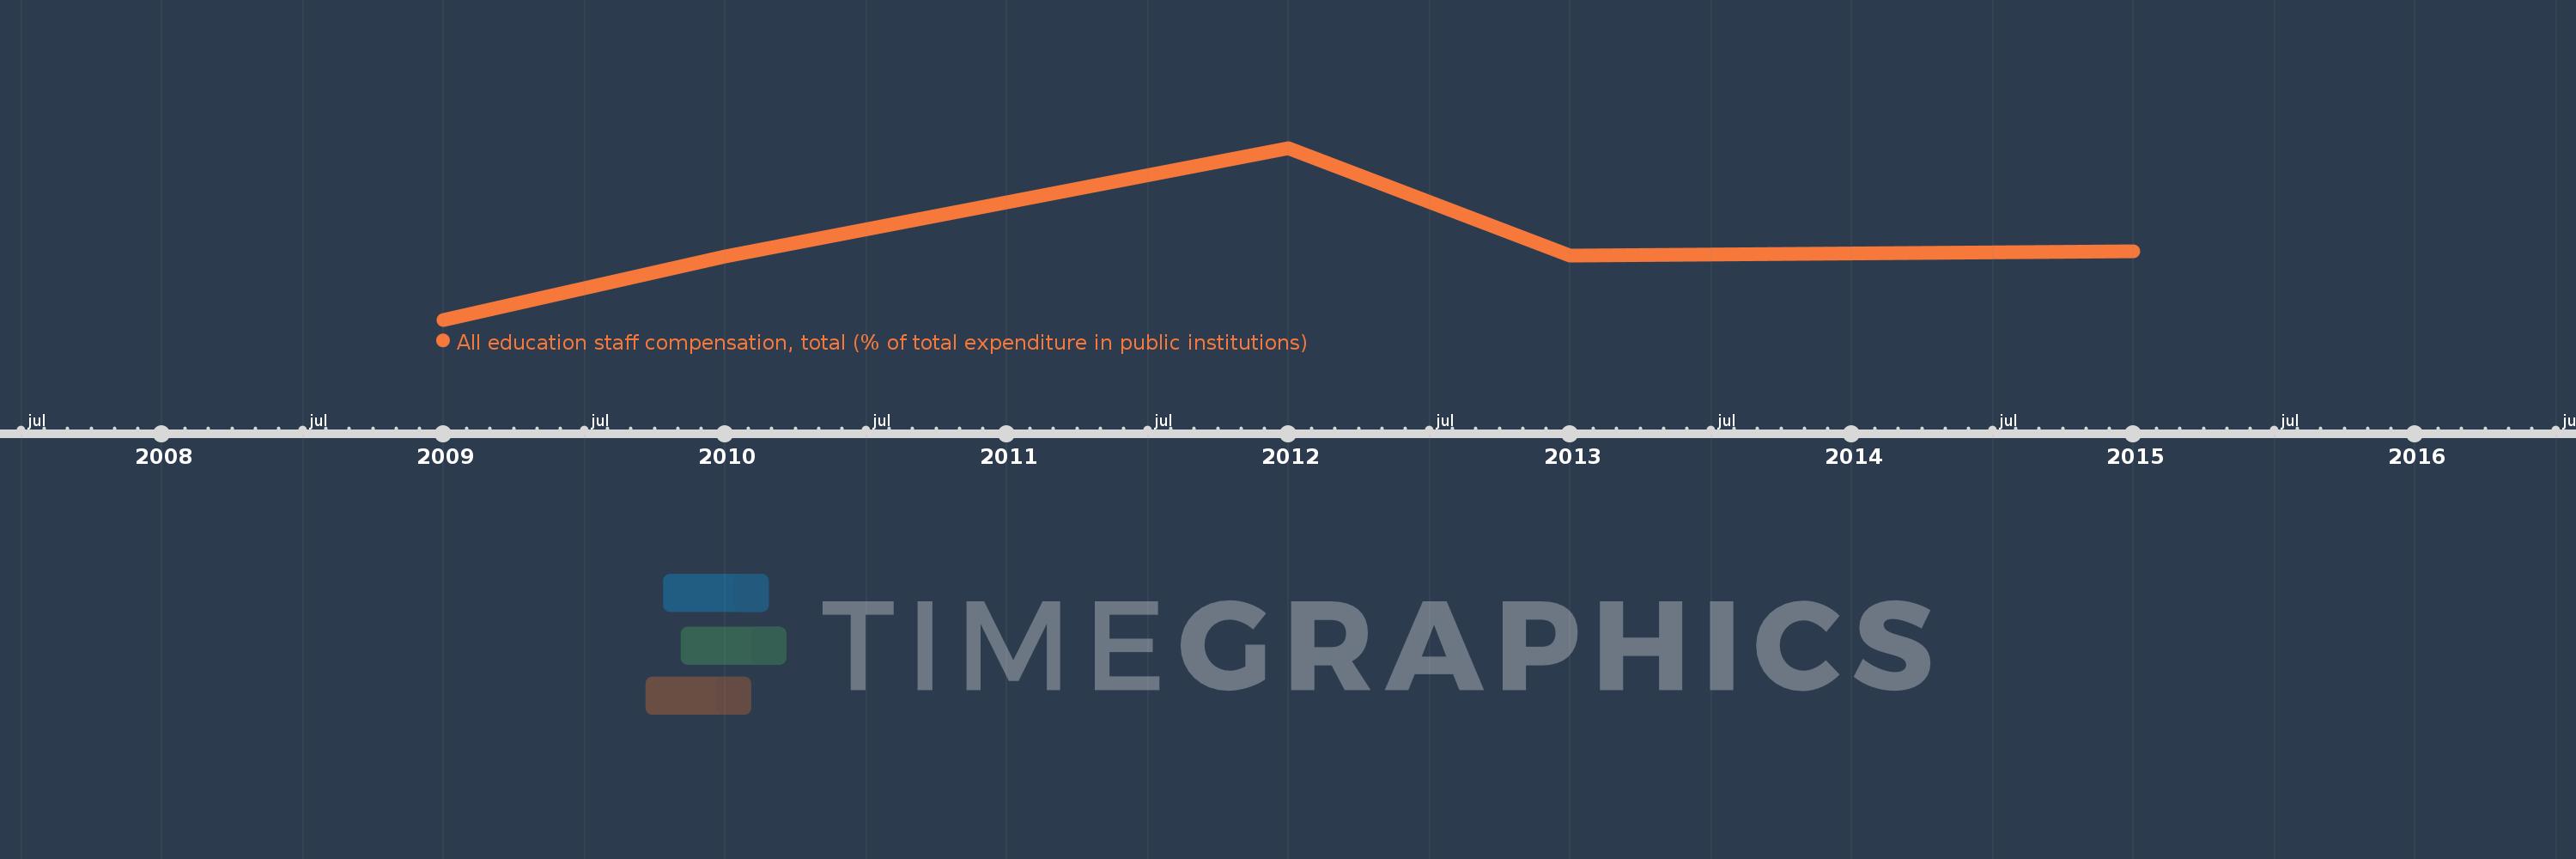
This timeline shows a graph from 2009 to 2015 of Bolivia. No data until 2008. Number of actual observations by date: 5.
Source name:
World Development Indicators
Source organization:
United Nations Educational, Scientific, and Cultural Organization (UNESCO) Institute for Statistics.
Categories, topics:
Education
Last updated:
apr 23, 2017
Indicators value changes by year
Minimum:
59.598
jan 1, 2009
Maximum:
82.811
jan 1, 2012
At the date of observation
Value
Absolute change
Change from the previous value
jan 1, 2009
59.598
+59.598
0.0%
jan 1, 2010
68.174
+8.576
14.39%
jan 1, 2012
82.811
+14.637
21.47%
jan 1, 2013
68.217
-14.594
-17.62%
jan 1, 2015
68.843
+0.627
0.92%
Ranking of countries by current statistics by years