Download This statistics in other country:
Timeline:
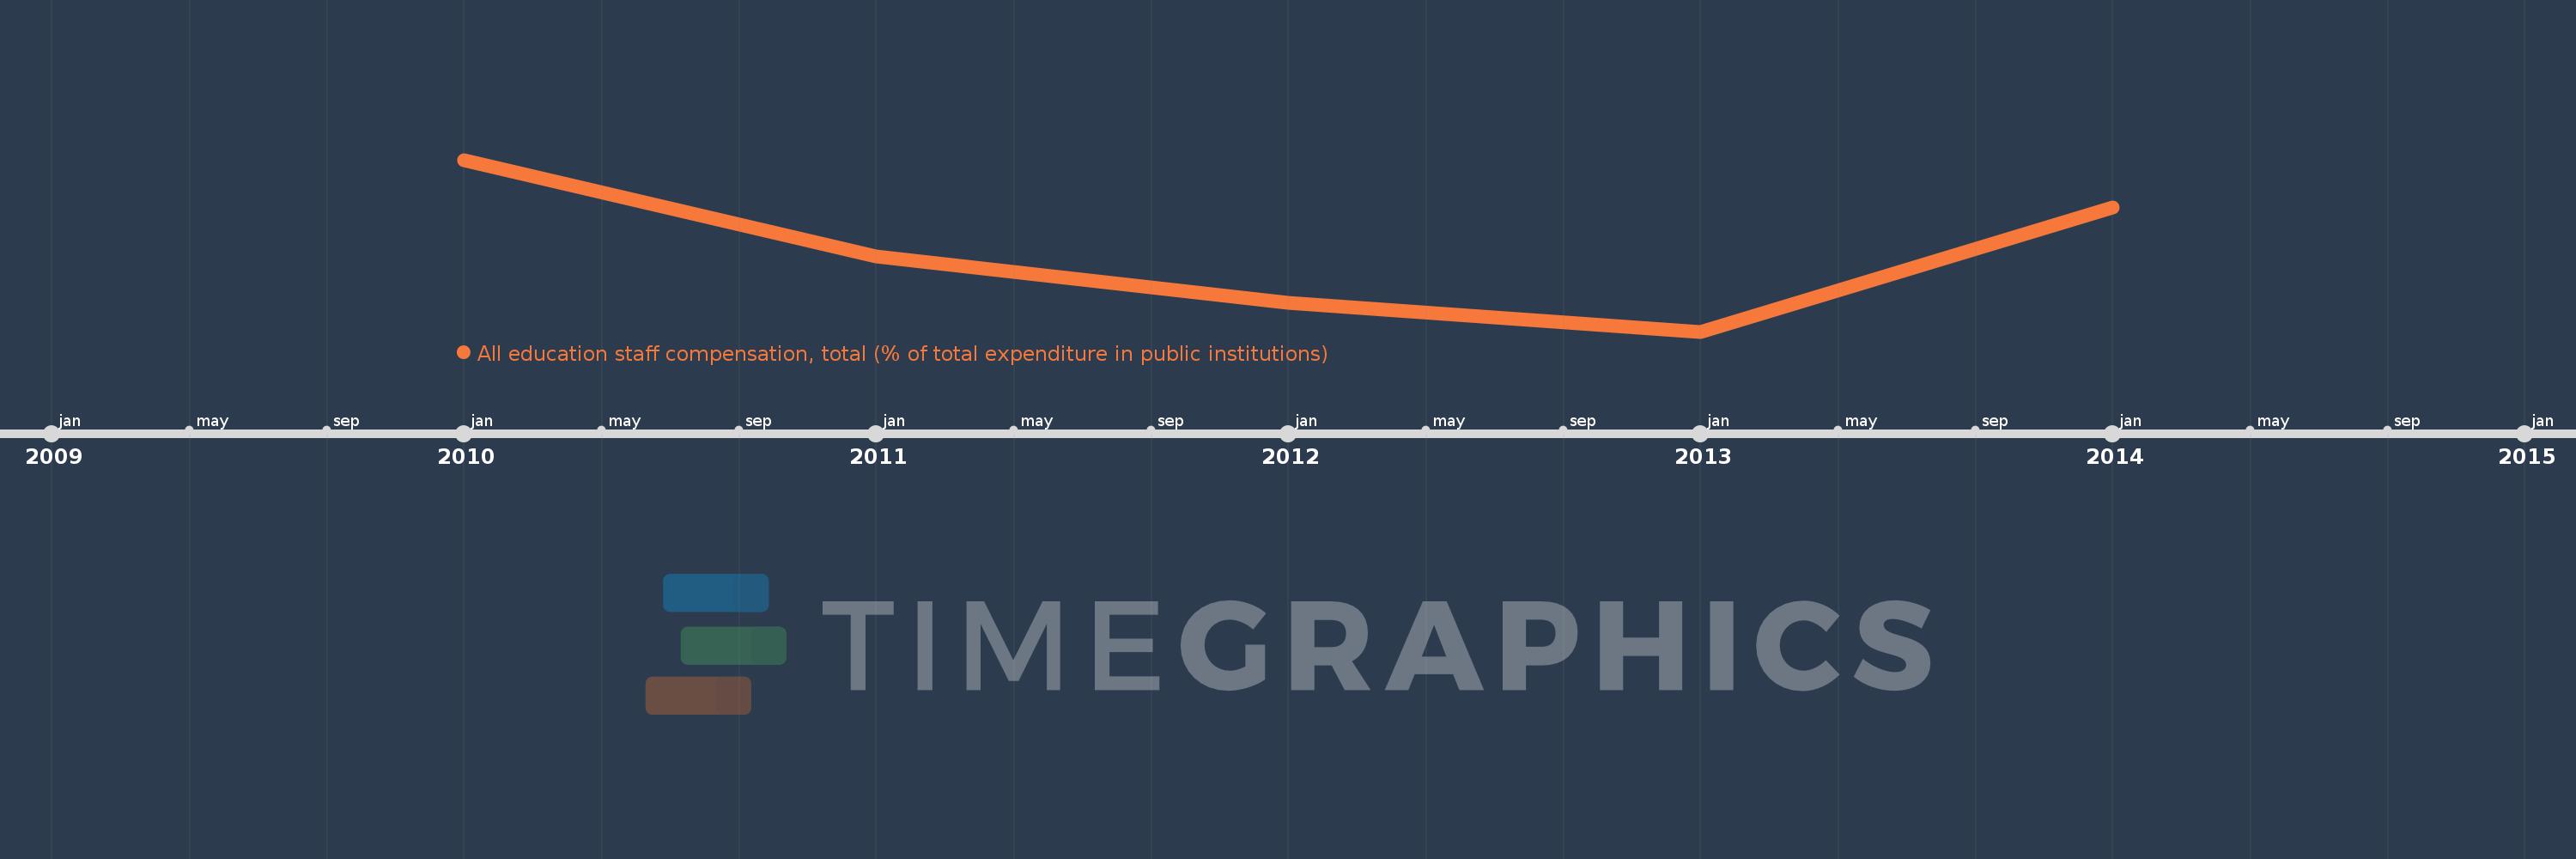
This timeline shows a graph from 2010 to 2014 of Macao SAR, China. No data until 2009. Number of actual observations by date: 5.
Source name:
World Development Indicators
Source organization:
United Nations Educational, Scientific, and Cultural Organization (UNESCO) Institute for Statistics.
Categories, topics:
Education
Last updated:
apr 23, 2017
Indicators value changes by year
Maximum:
60.187
jan 1, 2010
At the date of observation
Value
Absolute change
Change from the previous value
jan 1, 2010
60.187
+60.187
0.0%
jan 1, 2011
38.962
-21.225
-35.27%
jan 1, 2012
28.931
-10.031
-25.74%
jan 1, 2013
22.61
-6.321
-21.85%
jan 1, 2014
49.795
+27.185
120.23%
Ranking of countries by current statistics by years