Download This statistics in other country:
Timeline:
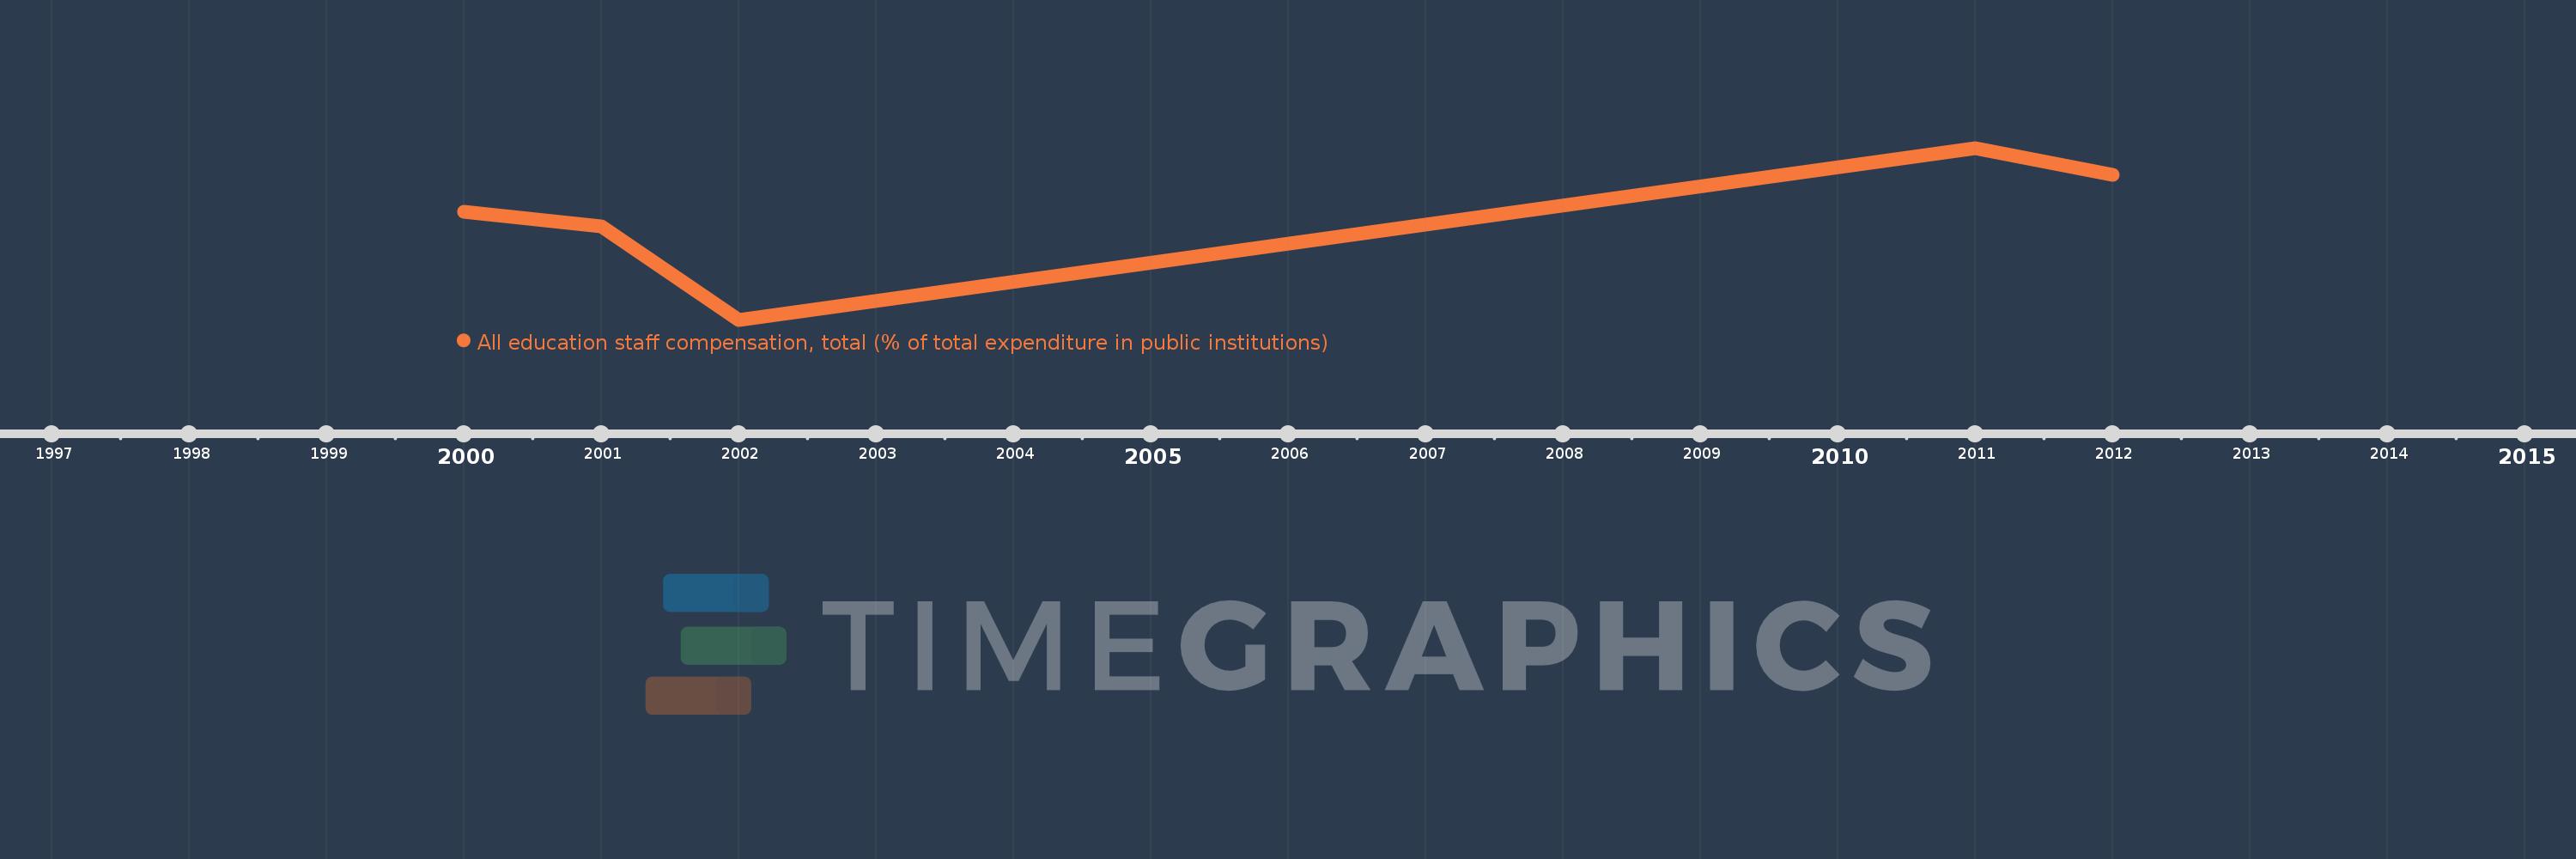
This timeline shows a graph from 2000 to 2012 of Rwanda. No data until 1999. Number of actual observations by date: 5.
Source name:
World Development Indicators
Source organization:
United Nations Educational, Scientific, and Cultural Organization (UNESCO) Institute for Statistics.
Categories, topics:
Education
Last updated:
apr 23, 2017
Indicators value changes by year
Minimum:
33.794
jan 1, 2002
Maximum:
58.727
jan 1, 2011
At the date of observation
Value
Absolute change
Change from the previous value
jan 1, 2000
49.481
+49.481
0.0%
jan 1, 2001
47.287
-2.194
-4.43%
jan 1, 2002
33.794
-13.493
-28.53%
jan 1, 2011
58.727
+24.933
73.78%
jan 1, 2012
54.773
-3.954
-6.73%
Ranking of countries by current statistics by years