Download This statistics in other country:
Timeline:
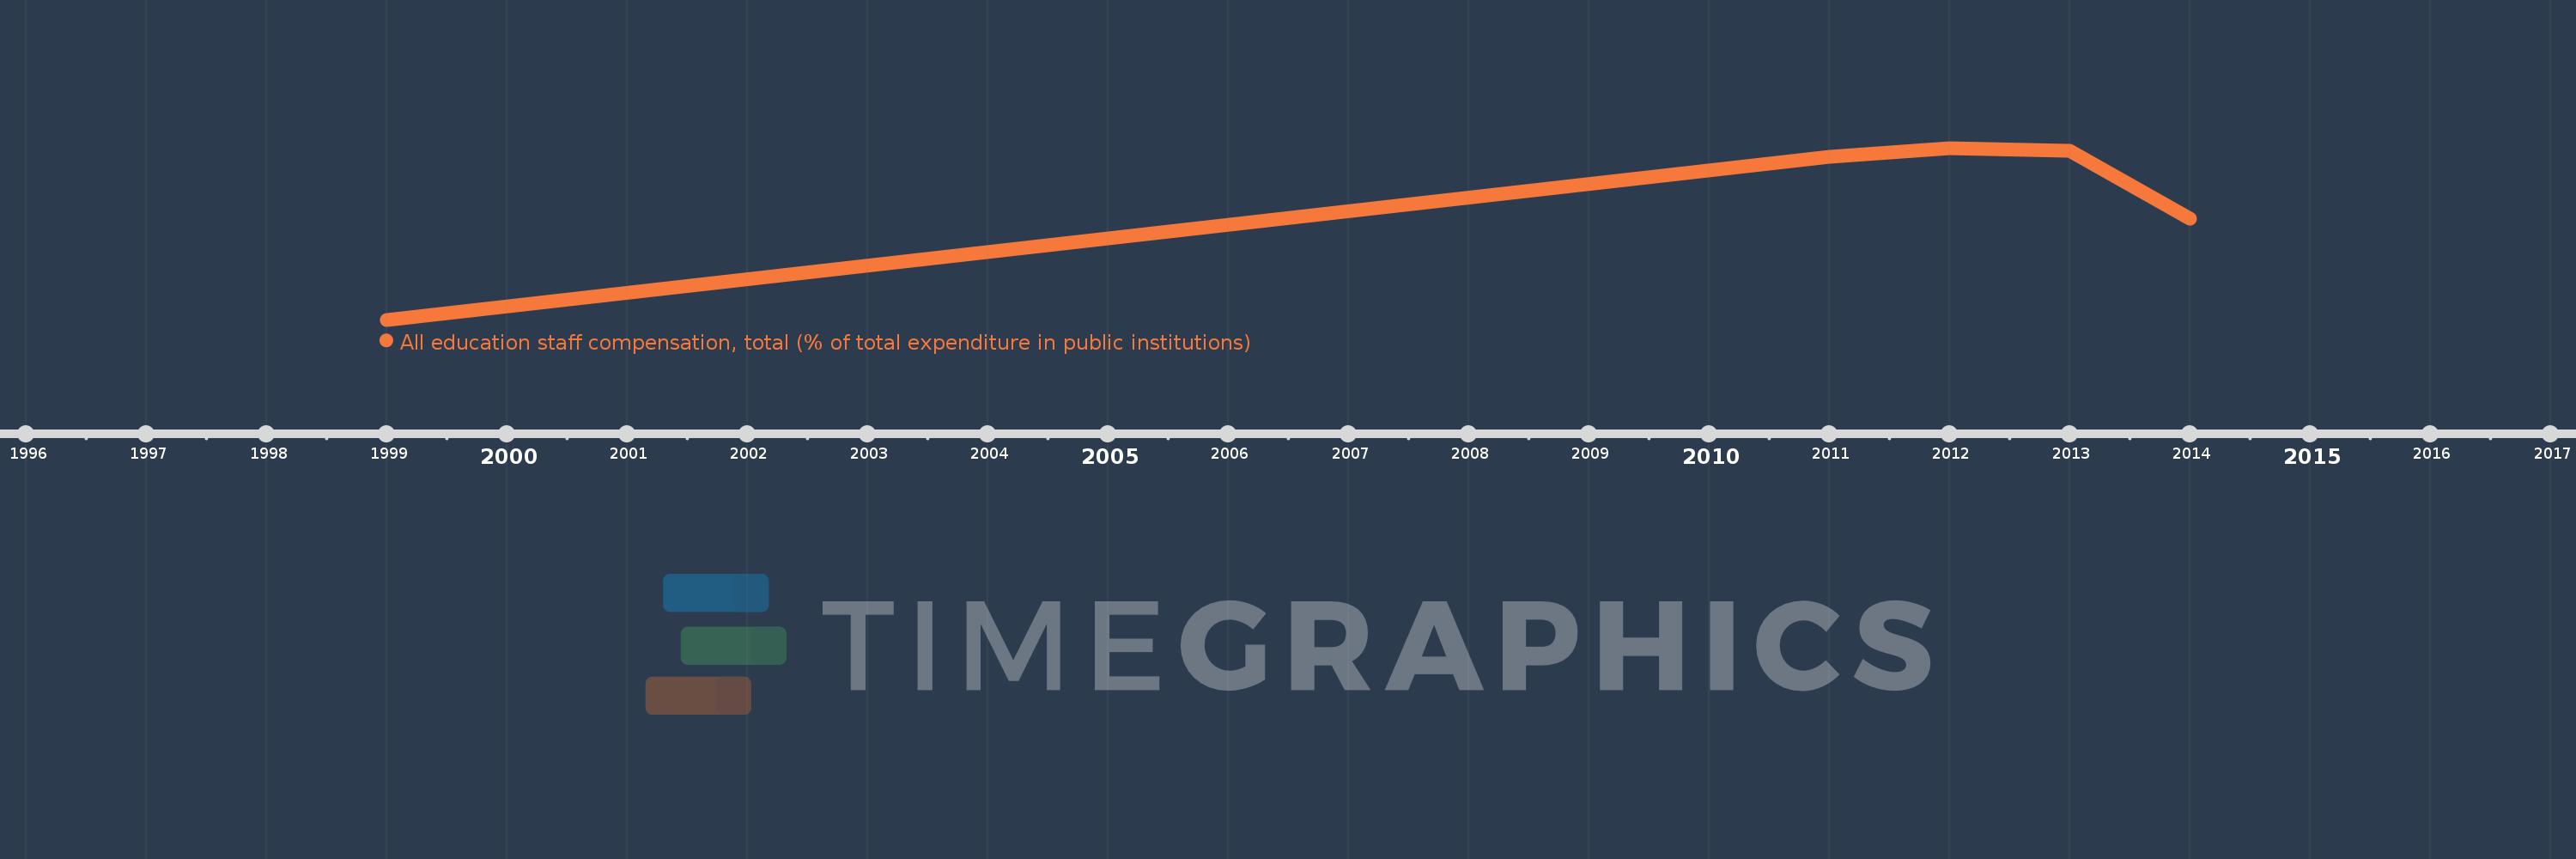
This timeline shows a graph from 1999 to 2014 of Guinea-Bissau. No data until 1998. Number of actual observations by date: 5.
Source name:
World Development Indicators
Source organization:
United Nations Educational, Scientific, and Cultural Organization (UNESCO) Institute for Statistics.
Categories, topics:
Education
Last updated:
apr 23, 2017
Indicators value changes by year
Minimum:
26.552
jan 1, 1999
Maximum:
63.378
jan 1, 2012
At the date of observation
Value
Absolute change
Change from the previous value
jan 1, 1999
26.552
+26.552
0.0%
jan 1, 2011
61.478
+34.926
131.54%
jan 1, 2012
63.378
+1.899
3.09%
jan 1, 2013
62.831
-0.547
-0.86%
jan 1, 2014
48.294
-14.537
-23.14%
Ranking of countries by current statistics by years