30
/
AIzaSyAYiBZKx7MnpbEhh9jyipgxe19OcubqV5w
April 1, 2024
128019
Eritrea
ERI
true
2
1
All education staff compensation, total (% of total expenditure in public institutions)
2007,2003,2002,2001
Download
Global statistics library →Eritrea →

All education staff compensation, total (% of total expenditure in public institutions)

This statistics in other country:

AfghanistanAlbaniaAndorraAntigua and BarbudaArgentinaArmeniaArubaAustraliaAustriaAzerbaijanBahrainBangladeshBarbadosBelarusBelgiumBelizeBeninBoliviaBrazilBritish Virgin IslandsBulgariaBurkina FasoBurundiCabo VerdeCameroonCanadaCaribbean small statesCayman IslandsCentral African RepublicCentral Europe and the BalticsChileChinaColombiaComorosCongo, Dem. Rep.Cote d'IvoireCroatiaCubaCuracaoCyprusCzech RepublicDenmarkDjiboutiDominicaDominican RepublicEcuadorEl SalvadorEritreaEstoniaEthiopiaEuro areaEurope & Central AsiaEurope & Central Asia (excluding high income)Europe & Central Asia (IDA & IBRD countries)European UnionFijiFinlandFranceGambia, TheGermanyGhanaGreeceGrenadaGuatemalaGuineaGuinea-BissauGuyanaHigh incomeHondurasHungaryIcelandIndiaIndonesiaIrelandIsraelItalyJamaicaJapanJordanKazakhstanKorea, Rep.KuwaitKyrgyz RepublicLate-demographic dividendLatin America & Caribbean Latin America & Caribbean (excluding high income)Latin America & the Caribbean (IDA & IBRD countries)LatviaLebanonLesothoLiberiaLiechtensteinLithuaniaLuxembourgMacao SAR, ChinaMacedonia, FYRMadagascarMalawiMalaysiaMaliMaltaMarshall IslandsMexicoMoldovaMonacoMongoliaMoroccoMozambiqueNamibiaNauruNetherlandsNicaraguaNigerNorth AmericaNorwayOECD membersOmanPakistanPanamaParaguayPeruPhilippinesPolandPortugalPost-demographic dividendPuerto RicoQatarRomaniaRussian FederationRwandaSan MarinoSenegalSerbiaSeychellesSierra LeoneSlovak RepublicSloveniaSouth AfricaSpainSri LankaSt. Kitts and NevisSt. LuciaSt. Vincent and the GrenadinesSwedenSwitzerlandThailandTimor-LesteTogoTunisiaTurkeyTurks and Caicos IslandsUgandaUkraineUnited KingdomUnited StatesUruguayVanuatuVenezuela, RBVietnamWest Bank and GazaZambia

Timeline:

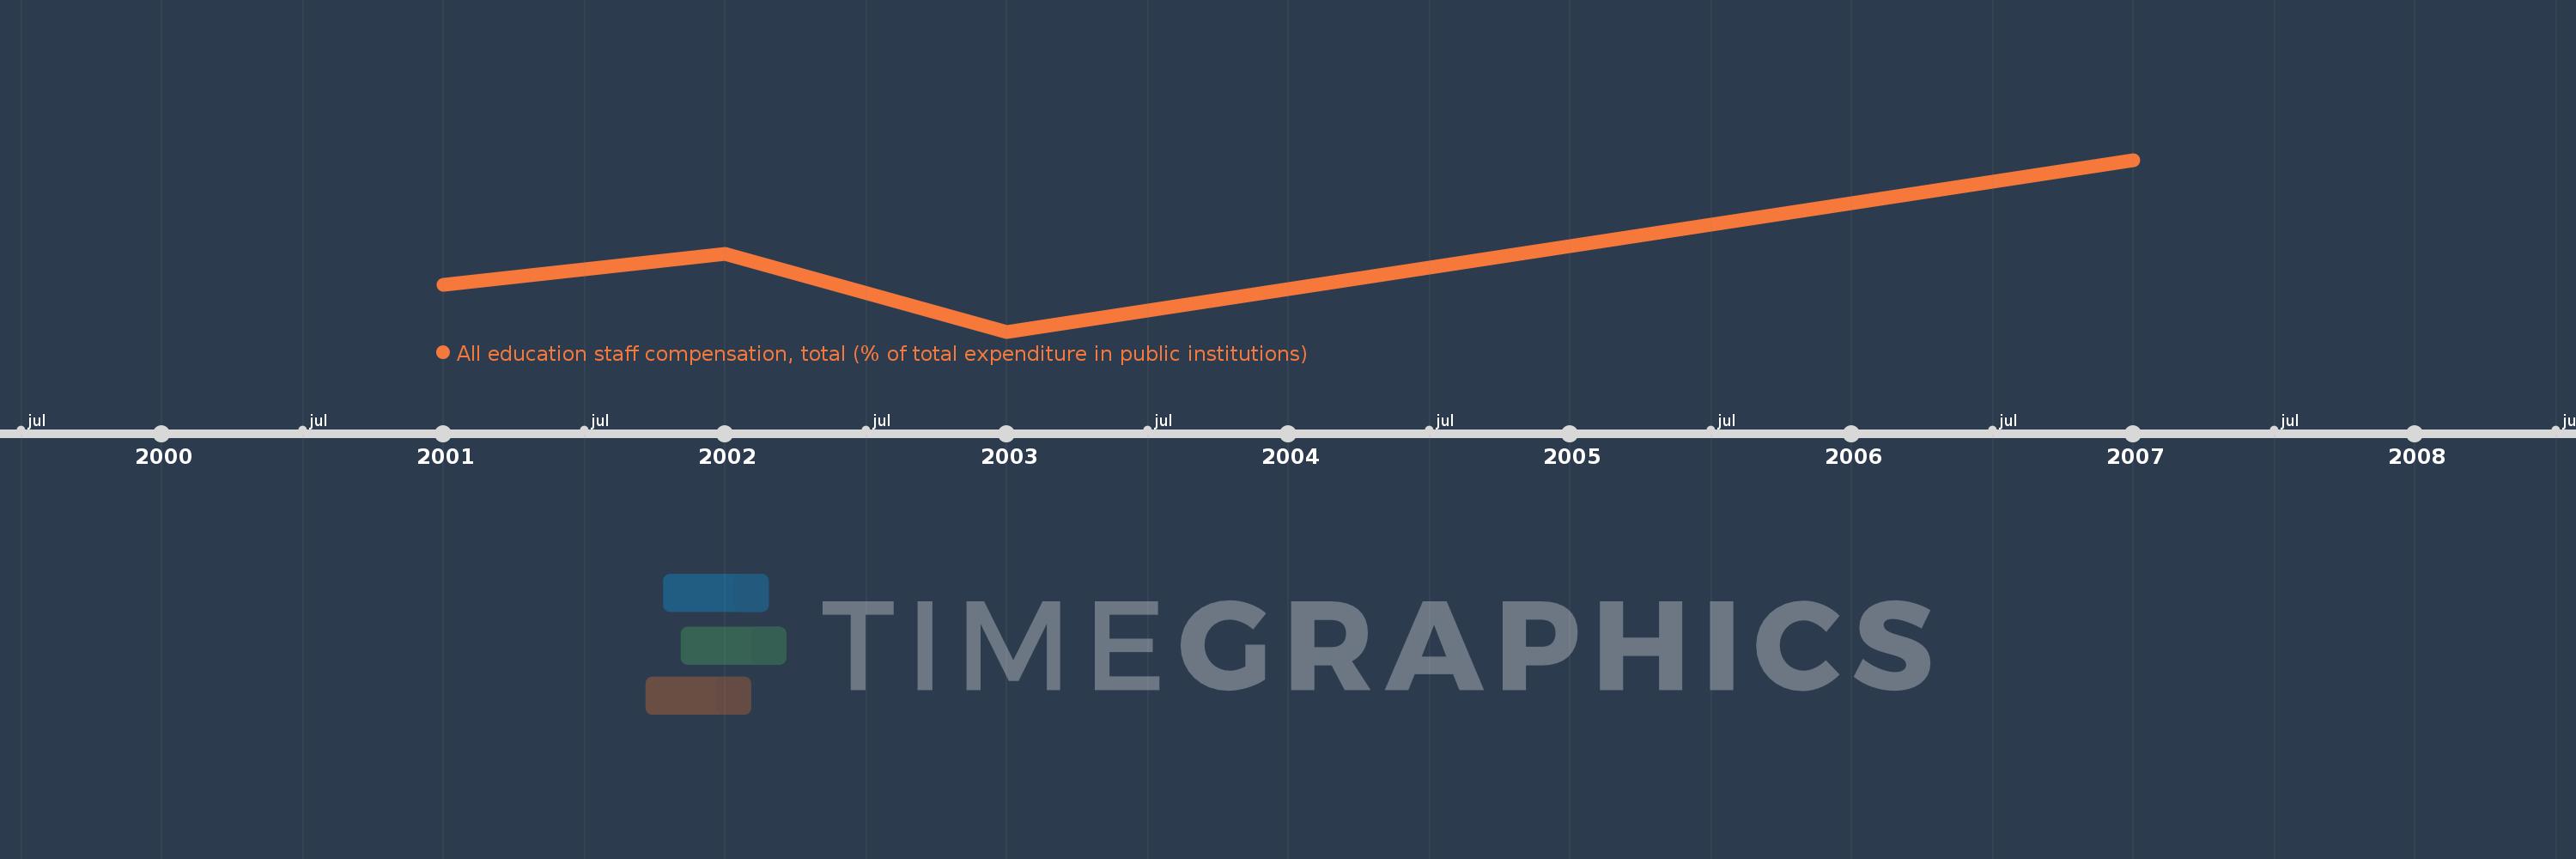
This timeline shows a graph from 2001 to 2007 of Eritrea. No data until 2000. Number of actual observations by date: 4.

Source name:

World Development Indicators

Source organization:

United Nations Educational, Scientific, and Cultural Organization (UNESCO) Institute for Statistics.

Categories, topics:

Education

Last updated:

apr 23, 2017

Indicators value changes by year

Meaning:
42.504
Minimum:
30.971
jan 1, 2003
Maximum:
57.722
jan 1, 2007
At the date of observation
Value
Absolute change
Change from the previous value
jan 1, 2001
38.288
+38.288
0.0%
jan 1, 2002
43.036
+4.748
12.4%
jan 1, 2003
30.971
-12.065
-28.03%
jan 1, 2007
57.722
+26.751
86.37%

Ranking of countries by current statistics by years