33
/
AIzaSyB4mHJ5NPEv-XzF7P6NDYXjlkCWaeKw5bc
November 30, 2025
118650
Denmark
DNK
true
2
1
All education staff compensation, total (% of total expenditure in public institutions)
2012,2011,2010,2009,2008,2007,2006,2005,2004,2003,2002,2001,2000,1999
Create a timeline
Public Timelines
For education
For educational institutions
For teachers
For students
Cabinet
For educational institutions
For teachers
For students
Open cabinet
FAQ
Close
Create a timeline
Public timelines
FAQ
About & Feedback
Terms
Privacy
FAQ
Support 24/7
Cabinet
Get premium
Donate
Download
Global statistics library
→
Denmark
→
All education staff compensation, total (% of total expenditure in public institutions)
This statistics in other country:
Afghanistan
Albania
Andorra
Antigua and Barbuda
Argentina
Armenia
Aruba
Australia
Austria
Azerbaijan
Bahrain
Bangladesh
Barbados
Belarus
Belgium
Belize
Benin
Bolivia
Brazil
British Virgin Islands
Bulgaria
Burkina Faso
Burundi
Cabo Verde
Cameroon
Canada
Caribbean small states
Cayman Islands
Central African Republic
Central Europe and the Baltics
Chile
China
Colombia
Comoros
Congo, Dem. Rep.
Cote d'Ivoire
Croatia
Cuba
Curacao
Cyprus
Czech Republic
Denmark
Djibouti
Dominica
Dominican Republic
Ecuador
El Salvador
Eritrea
Estonia
Ethiopia
Euro area
Europe & Central Asia
Europe & Central Asia (excluding high income)
Europe & Central Asia (IDA & IBRD countries)
European Union
Fiji
Finland
France
Gambia, The
Germany
Ghana
Greece
Grenada
Guatemala
Guinea
Guinea-Bissau
Guyana
High income
Honduras
Hungary
Iceland
India
Indonesia
Ireland
Israel
Italy
Jamaica
Japan
Jordan
Kazakhstan
Korea, Rep.
Kuwait
Kyrgyz Republic
Late-demographic dividend
Latin America & Caribbean
Latin America & Caribbean (excluding high income)
Latin America & the Caribbean (IDA & IBRD countries)
Latvia
Lebanon
Lesotho
Liberia
Liechtenstein
Lithuania
Luxembourg
Macao SAR, China
Macedonia, FYR
Madagascar
Malawi
Malaysia
Mali
Malta
Marshall Islands
Mexico
Moldova
Monaco
Mongolia
Morocco
Mozambique
Namibia
Nauru
Netherlands
Nicaragua
Niger
North America
Norway
OECD members
Oman
Pakistan
Panama
Paraguay
Peru
Philippines
Poland
Portugal
Post-demographic dividend
Puerto Rico
Qatar
Romania
Russian Federation
Rwanda
San Marino
Senegal
Serbia
Seychelles
Sierra Leone
Slovak Republic
Slovenia
South Africa
Spain
Sri Lanka
St. Kitts and Nevis
St. Lucia
St. Vincent and the Grenadines
Sweden
Switzerland
Thailand
Timor-Leste
Togo
Tunisia
Turkey
Turks and Caicos Islands
Uganda
Ukraine
United Kingdom
United States
Uruguay
Vanuatu
Venezuela, RB
Vietnam
West Bank and Gaza
Zambia
Timeline:
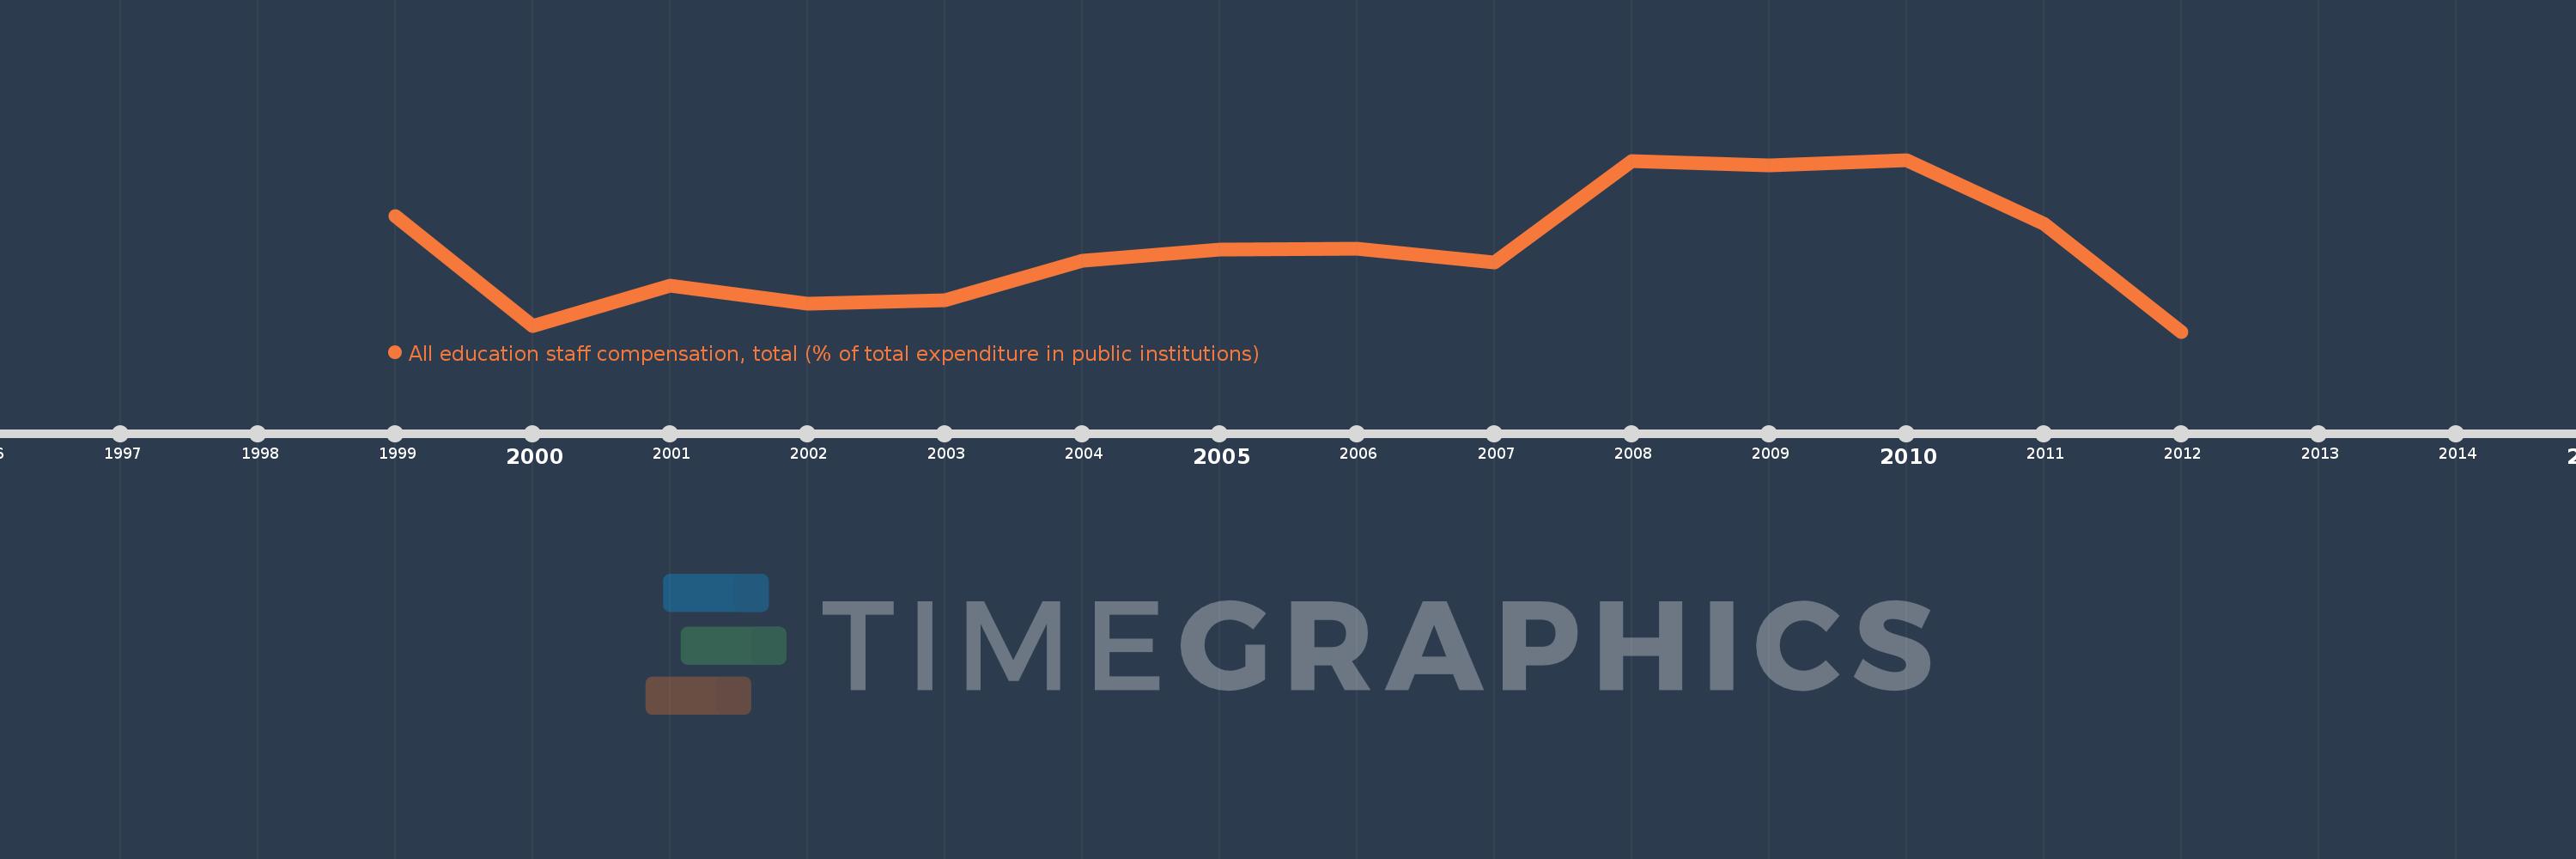
This timeline shows a graph from
1999
to
2012
of Denmark. No data until
1998
. Number of actual observations by date:
14
.
Source name:
World Development Indicators
Source organization:
United Nations Educational, Scientific, and Cultural Organization (UNESCO) Institute for Statistics.
Categories, topics:
Education
Last updated:
apr 23, 2017
Indicators value changes by year
Meaning:
74.017
Minimum:
71.086
jan 1, 2012
Maximum:
77.232
jan 1, 2010
At the date of observation
Value
Absolute change
Change from the previous value
jan 1, 1999
75.223
+75.223
0.0%
jan 1, 2000
71.287
-3.936
-5.23%
jan 1, 2001
72.726
+1.439
2.02%
jan 1, 2002
72.099
-0.627
-0.86%
jan 1, 2003
72.219
+0.121
0.17%
jan 1, 2004
73.607
+1.388
1.92%
jan 1, 2005
74.021
+0.414
0.56%
jan 1, 2006
74.063
+0.042
0.06%
jan 1, 2007
73.552
-0.511
-0.69%
jan 1, 2008
77.171
+3.619
4.92%
jan 1, 2009
77.018
-0.153
-0.2%
jan 1, 2010
77.232
+0.214
0.28%
jan 1, 2011
74.941
-2.291
-2.97%
jan 1, 2012
71.086
-3.855
-5.14%
Ranking of countries by current statistics by years
About & Feedback
Terms
Privacy
FAQ
Support 24/7
Cabinet
Get premium
Donate
The service accepts bank transfer (ACH, Wire) or cards (Visa, MasterCard, etc). Processed by Stripe.
Secured with SSL