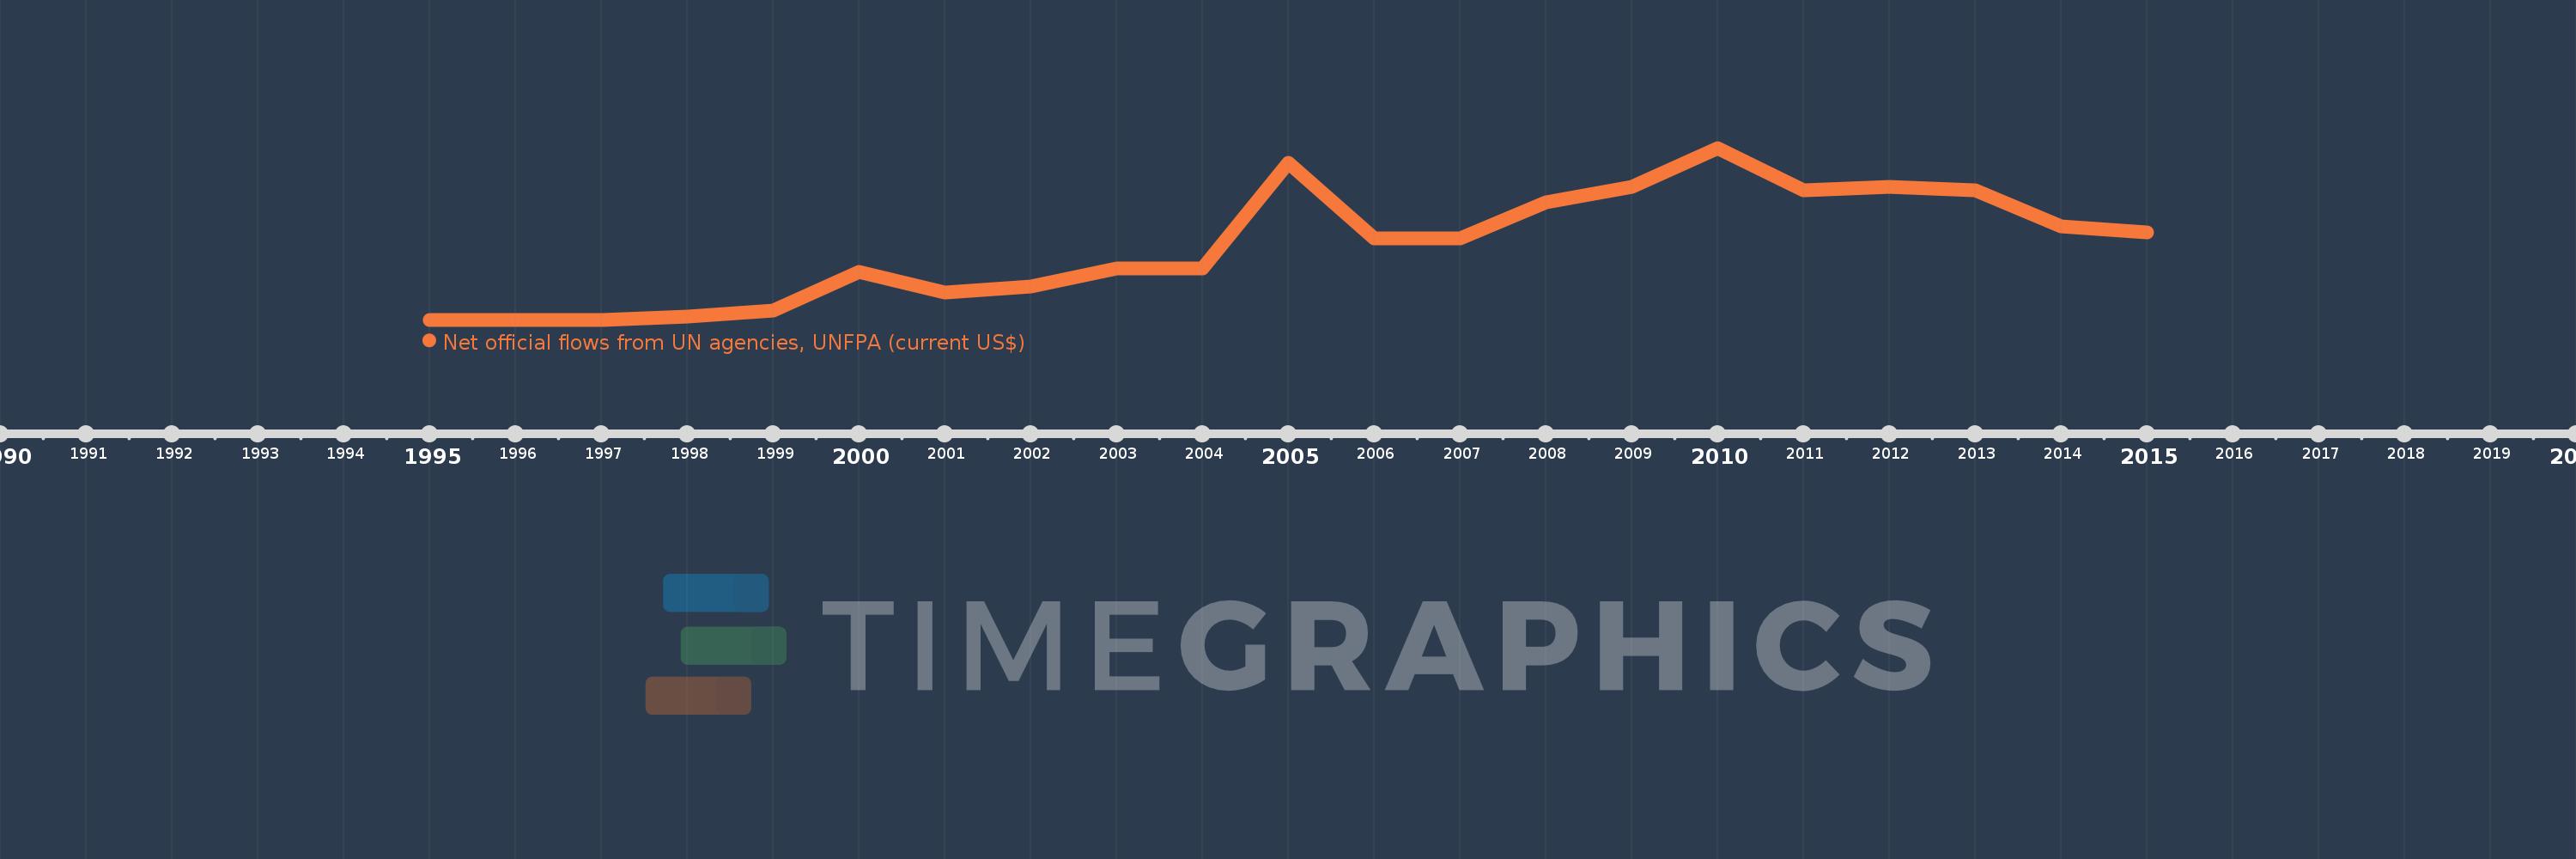
This timeline shows a graph from 1995 to 2015 of Belarus. No data until 1994. Number of actual observations by date: 20.
Source name:
World Development Indicators
Source organization:
Development Assistance Committee of the Organisation for Economic Co-operation and Development, Geographical Distribution of Financial Flows to Developing Countries, Development Co-operation Report, and International Development Statistics database. Data are available online at: www.oecd.org/dac/stats/idsonline.
Categories, topics:
Aid Effectiveness
Last updated:
apr 23, 2017
Indicators value changes by year
Meaning:
265.0K
Minimum:
10.0K
jan 1, 1995
Maximum:
580.0K
jan 1, 2010
At the date of observation
Value
Absolute change
Change from the previous value
jan 1, 1995
10.0K
+10.0K
0.0%
jan 1, 1997
10.0K
0.0
0.0%
jan 1, 1998
20.0K
+10.0K
100.0%
jan 1, 1999
40.0K
+20.0K
100.0%
jan 1, 2000
170.0K
+130.0K
325.0%
jan 1, 2001
100.0K
-70.0K
-41.18%
jan 1, 2002
120.0K
+20.0K
20.0%
jan 1, 2003
180.0K
+60.0K
50.0%
jan 1, 2004
180.0K
0.0
0.0%
jan 1, 2005
530.0K
+350.0K
194.44%
jan 1, 2006
280.0K
-250.0K
-47.17%
jan 1, 2007
280.0K
0.0
0.0%
jan 1, 2008
400.0K
+120.0K
42.86%
jan 1, 2009
450.0K
+50.0K
12.5%
jan 1, 2010
580.0K
+130.0K
28.89%
jan 1, 2011
440.0K
-140.0K
-24.14%
jan 1, 2012
450.0K
+10.0K
2.27%
jan 1, 2013
440.0K
-10.0K
-2.22%
jan 1, 2014
320.0K
-120.0K
-27.27%
jan 1, 2015
300.0K
-20.0K
-6.25%
Ranking of countries by current statistics by years