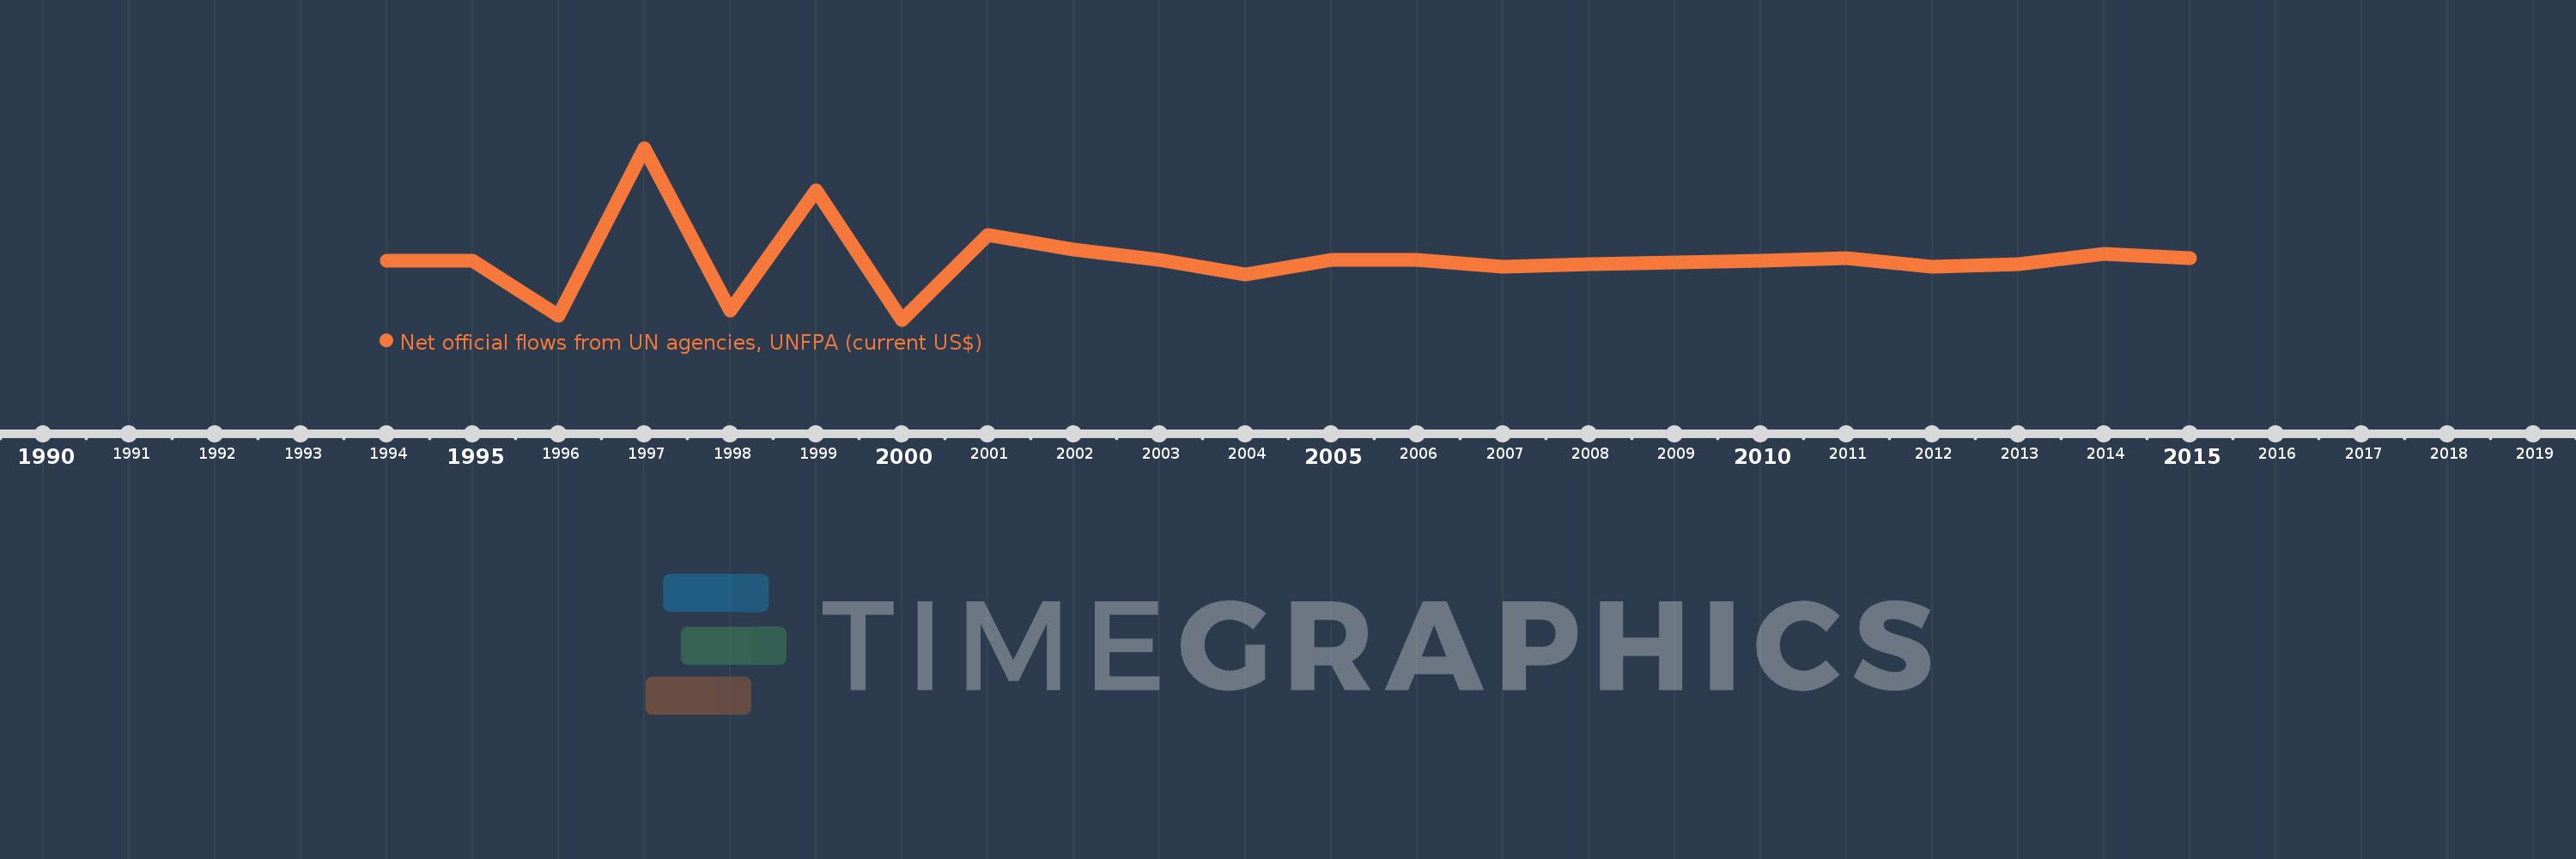
This timeline shows a graph from 1994 to 2015 of Kazakhstan. No data until 1993. Number of actual observations by date: 22.
Source name:
World Development Indicators
Source organization:
Development Assistance Committee of the Organisation for Economic Co-operation and Development, Geographical Distribution of Financial Flows to Developing Countries, Development Co-operation Report, and International Development Statistics database. Data are available online at: www.oecd.org/dac/stats/idsonline.
Categories, topics:
Aid Effectiveness
Last updated:
apr 23, 2017
Indicators value changes by year
Meaning:
613.636K
Minimum:
200.0K
jan 1, 2000
Maximum:
1.37 mln
jan 1, 1997
At the date of observation
Value
Absolute change
Change from the previous value
jan 1, 1994
600.0K
+600.0K
0.0%
jan 1, 1995
600.0K
0.0
0.0%
jan 1, 1996
230.0K
-370.0K
-61.67%
jan 1, 1997
1.37 mln
+1.14 mln
495.65%
jan 1, 1998
260.0K
-1.11 mln
-81.02%
jan 1, 1999
1.08 mln
+820.0K
315.38%
jan 1, 2000
200.0K
-880.0K
-81.48%
jan 1, 2001
780.0K
+580.0K
290.0%
jan 1, 2002
680.0K
-100.0K
-12.82%
jan 1, 2003
610.0K
-70.0K
-10.29%
jan 1, 2004
510.0K
-100.0K
-16.39%
jan 1, 2005
610.0K
+100.0K
19.61%
jan 1, 2006
610.0K
0.0
0.0%
jan 1, 2007
560.0K
-50.0K
-8.2%
jan 1, 2008
580.0K
+20.0K
3.57%
jan 1, 2009
590.0K
+10.0K
1.72%
jan 1, 2010
600.0K
+10.0K
1.69%
jan 1, 2011
620.0K
+20.0K
3.33%
jan 1, 2012
560.0K
-60.0K
-9.68%
jan 1, 2013
580.0K
+20.0K
3.57%
jan 1, 2014
650.0K
+70.0K
12.07%
jan 1, 2015
620.0K
-30.0K
-4.62%
Ranking of countries by current statistics by years