33
/
AIzaSyB4mHJ5NPEv-XzF7P6NDYXjlkCWaeKw5bc
November 1, 2025
33721
European Union
EUU
false
2
1
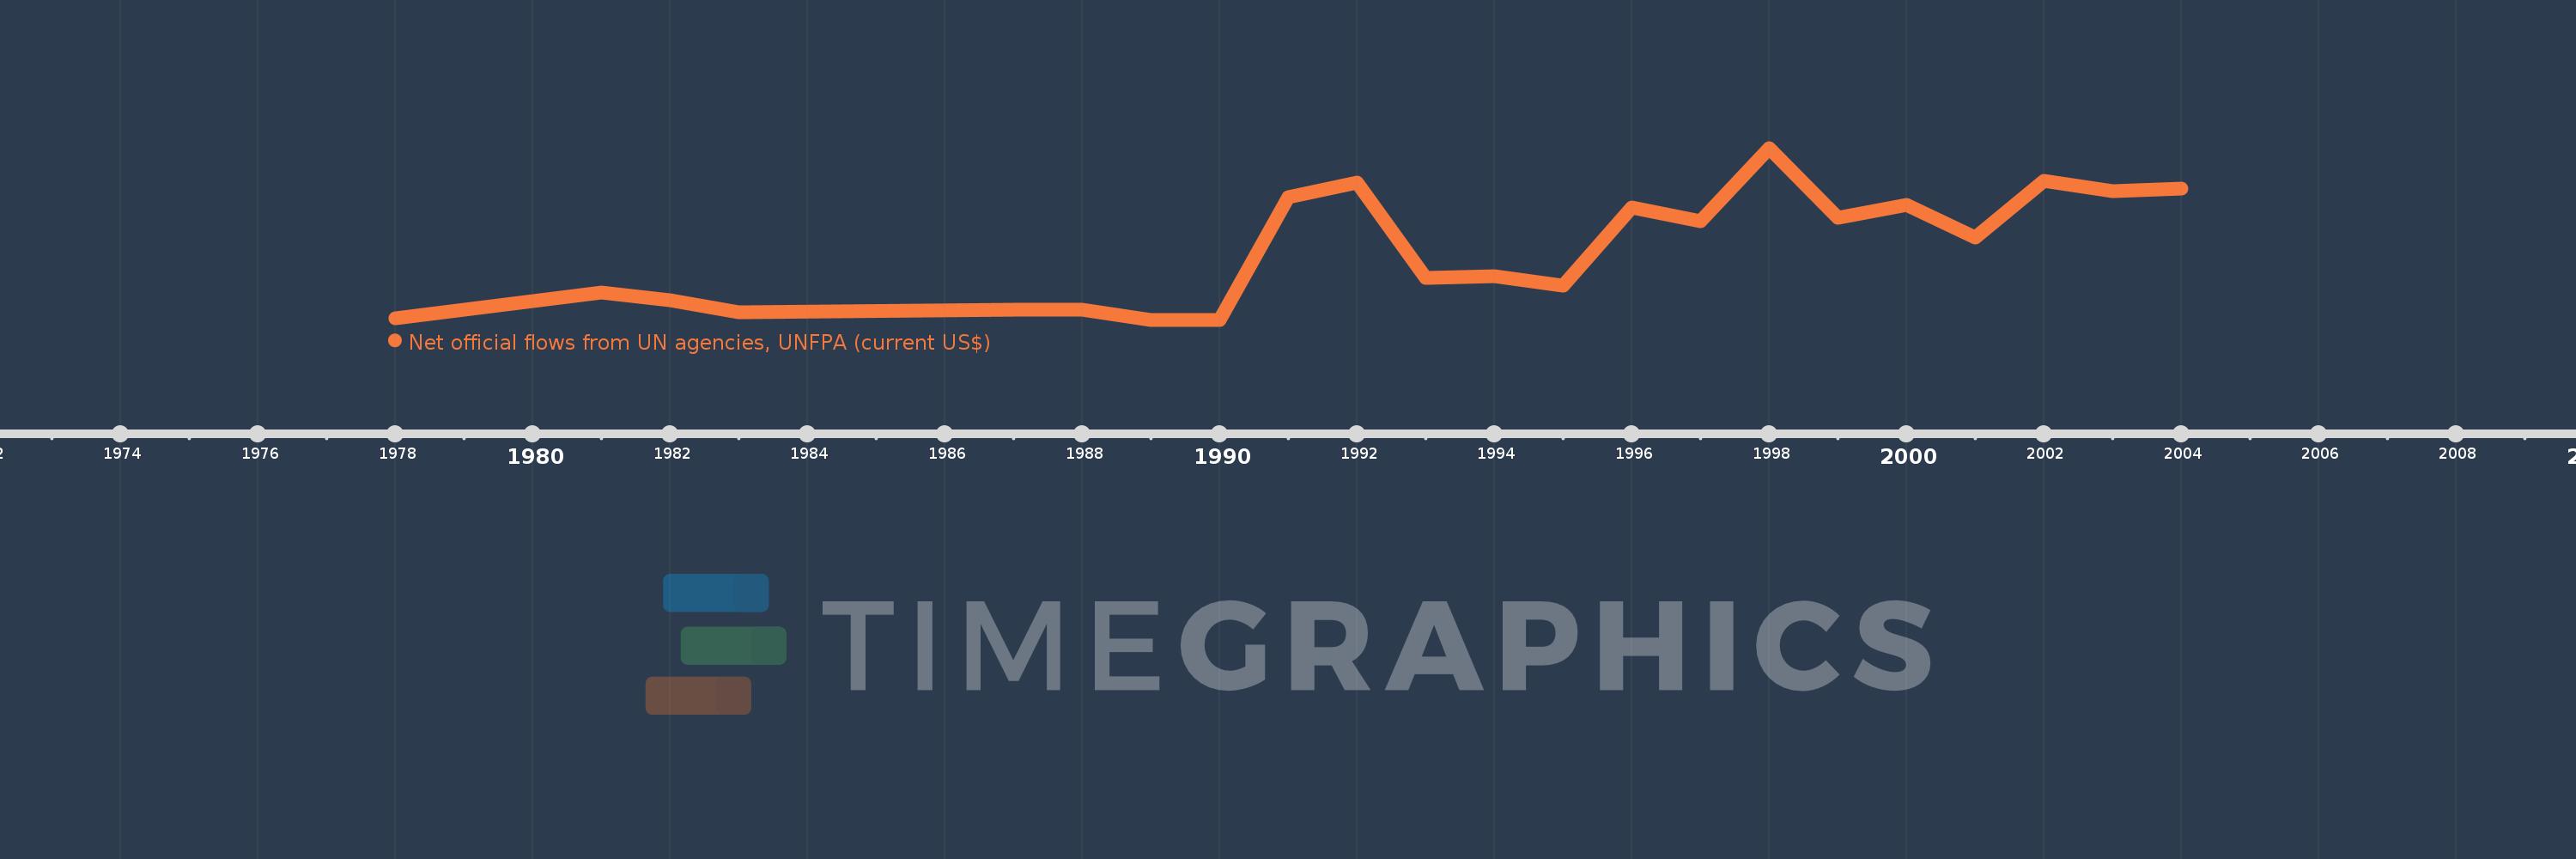
Net official flows from UN agencies, UNFPA (current US$)
2004,2003,2002,2001,2000,1999,1998,1997,1996,1995,1994,1993,1992,1991,1990,1989,1988,1987,1983,1982,1981,1978