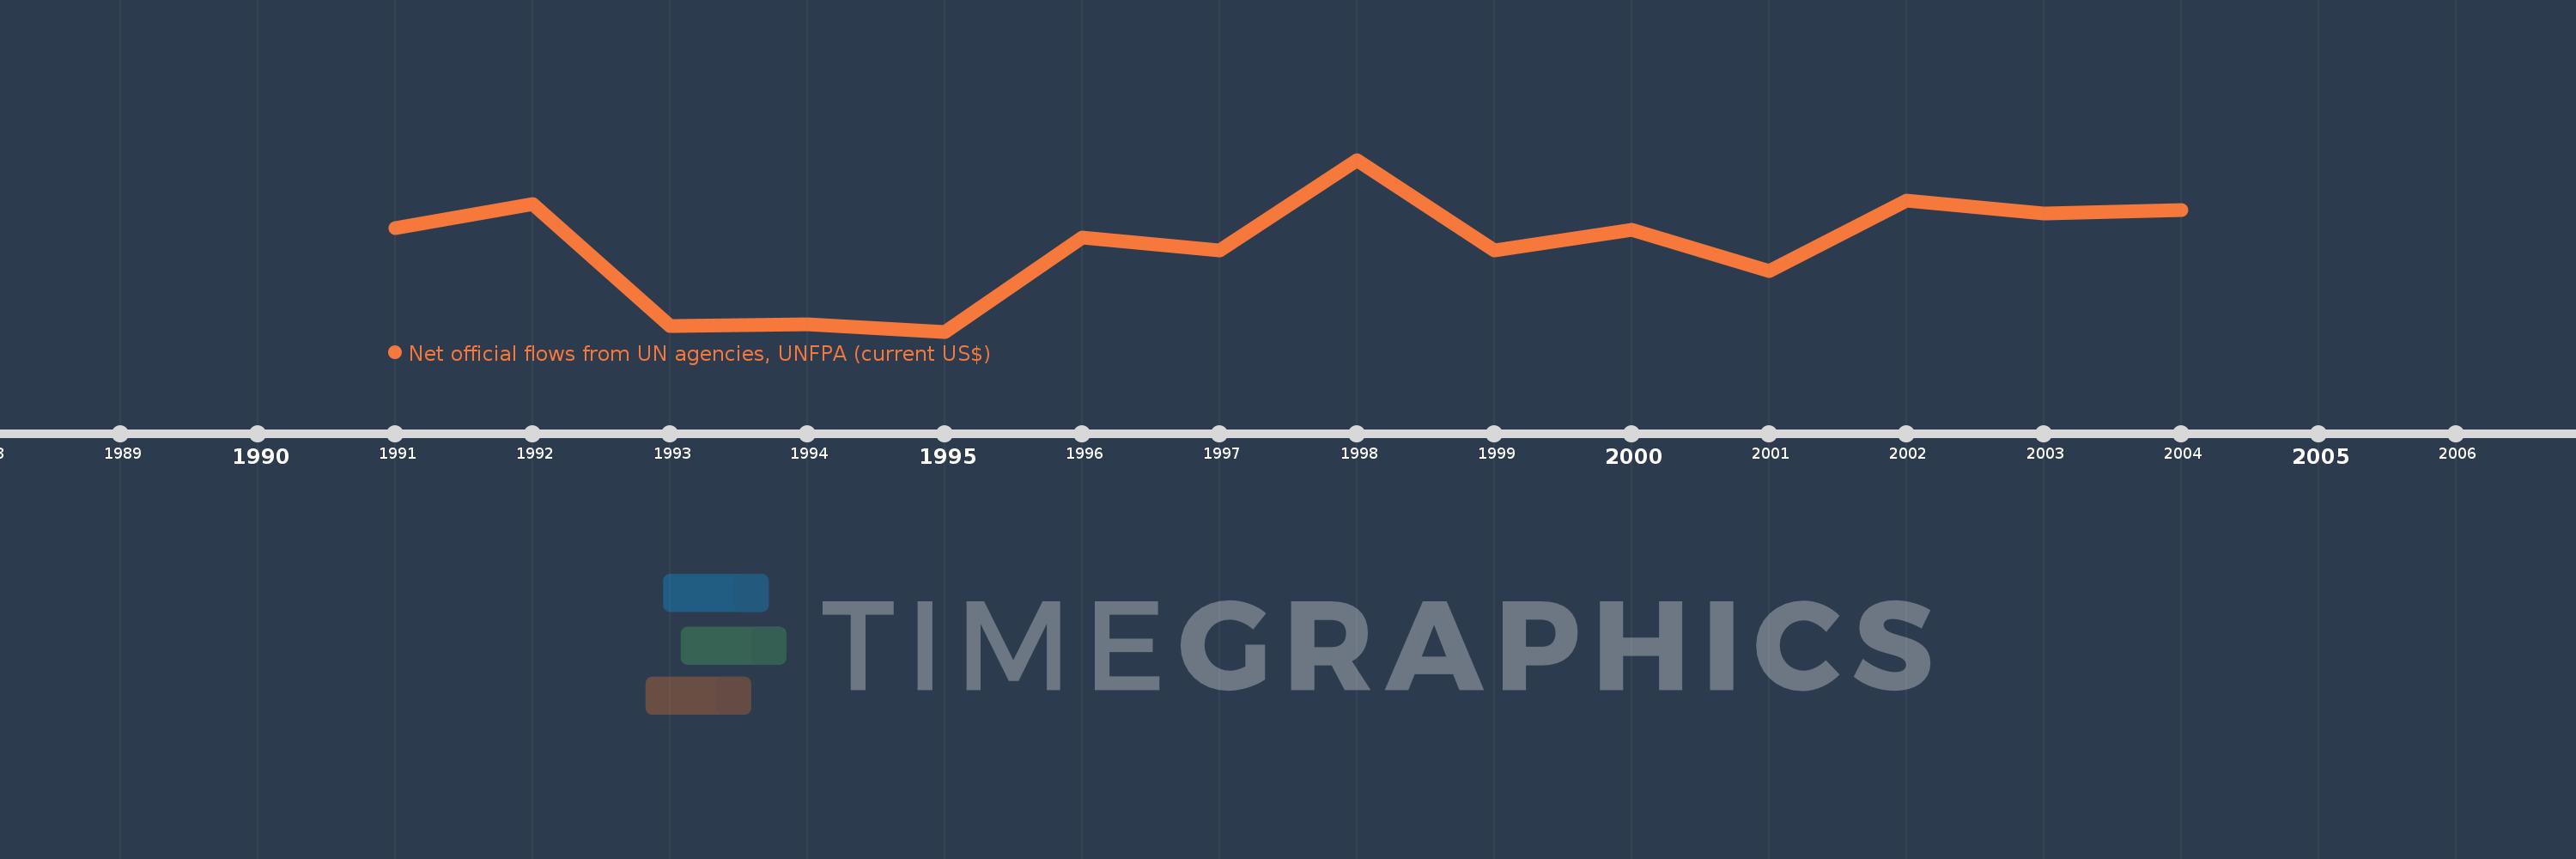
This timeline shows a graph from 1991 to 2004 of Central Europe and the Baltics. No data until 1990. Number of actual observations by date: 14.
Source name:
World Development Indicators
Source organization:
Development Assistance Committee of the Organisation for Economic Co-operation and Development, Geographical Distribution of Financial Flows to Developing Countries, Development Co-operation Report, and International Development Statistics database. Data are available online at: www.oecd.org/dac/stats/idsonline.
Categories, topics:
Aid Effectiveness
Last updated:
apr 23, 2017
Indicators value changes by year
Meaning:
696.429K
Minimum:
230.0K
jan 1, 1995
Maximum:
1.16 mln
jan 1, 1998
At the date of observation
Value
Absolute change
Change from the previous value
jan 1, 1991
790.0K
+790.0K
0.0%
jan 1, 1992
920.0K
+130.0K
16.46%
jan 1, 1993
260.0K
-660.0K
-71.74%
jan 1, 1994
270.0K
+10.0K
3.85%
jan 1, 1995
230.0K
-40.0K
-14.81%
jan 1, 1996
740.0K
+510.0K
221.74%
jan 1, 1997
670.0K
-70.0K
-9.46%
jan 1, 1998
1.16 mln
+490.0K
73.13%
jan 1, 1999
670.0K
-490.0K
-42.24%
jan 1, 2000
780.0K
+110.0K
16.42%
jan 1, 2001
560.0K
-220.0K
-28.21%
jan 1, 2002
940.0K
+380.0K
67.86%
jan 1, 2003
870.0K
-70.0K
-7.45%
jan 1, 2004
890.0K
+20.0K
2.3%
Ranking of countries by current statistics by years