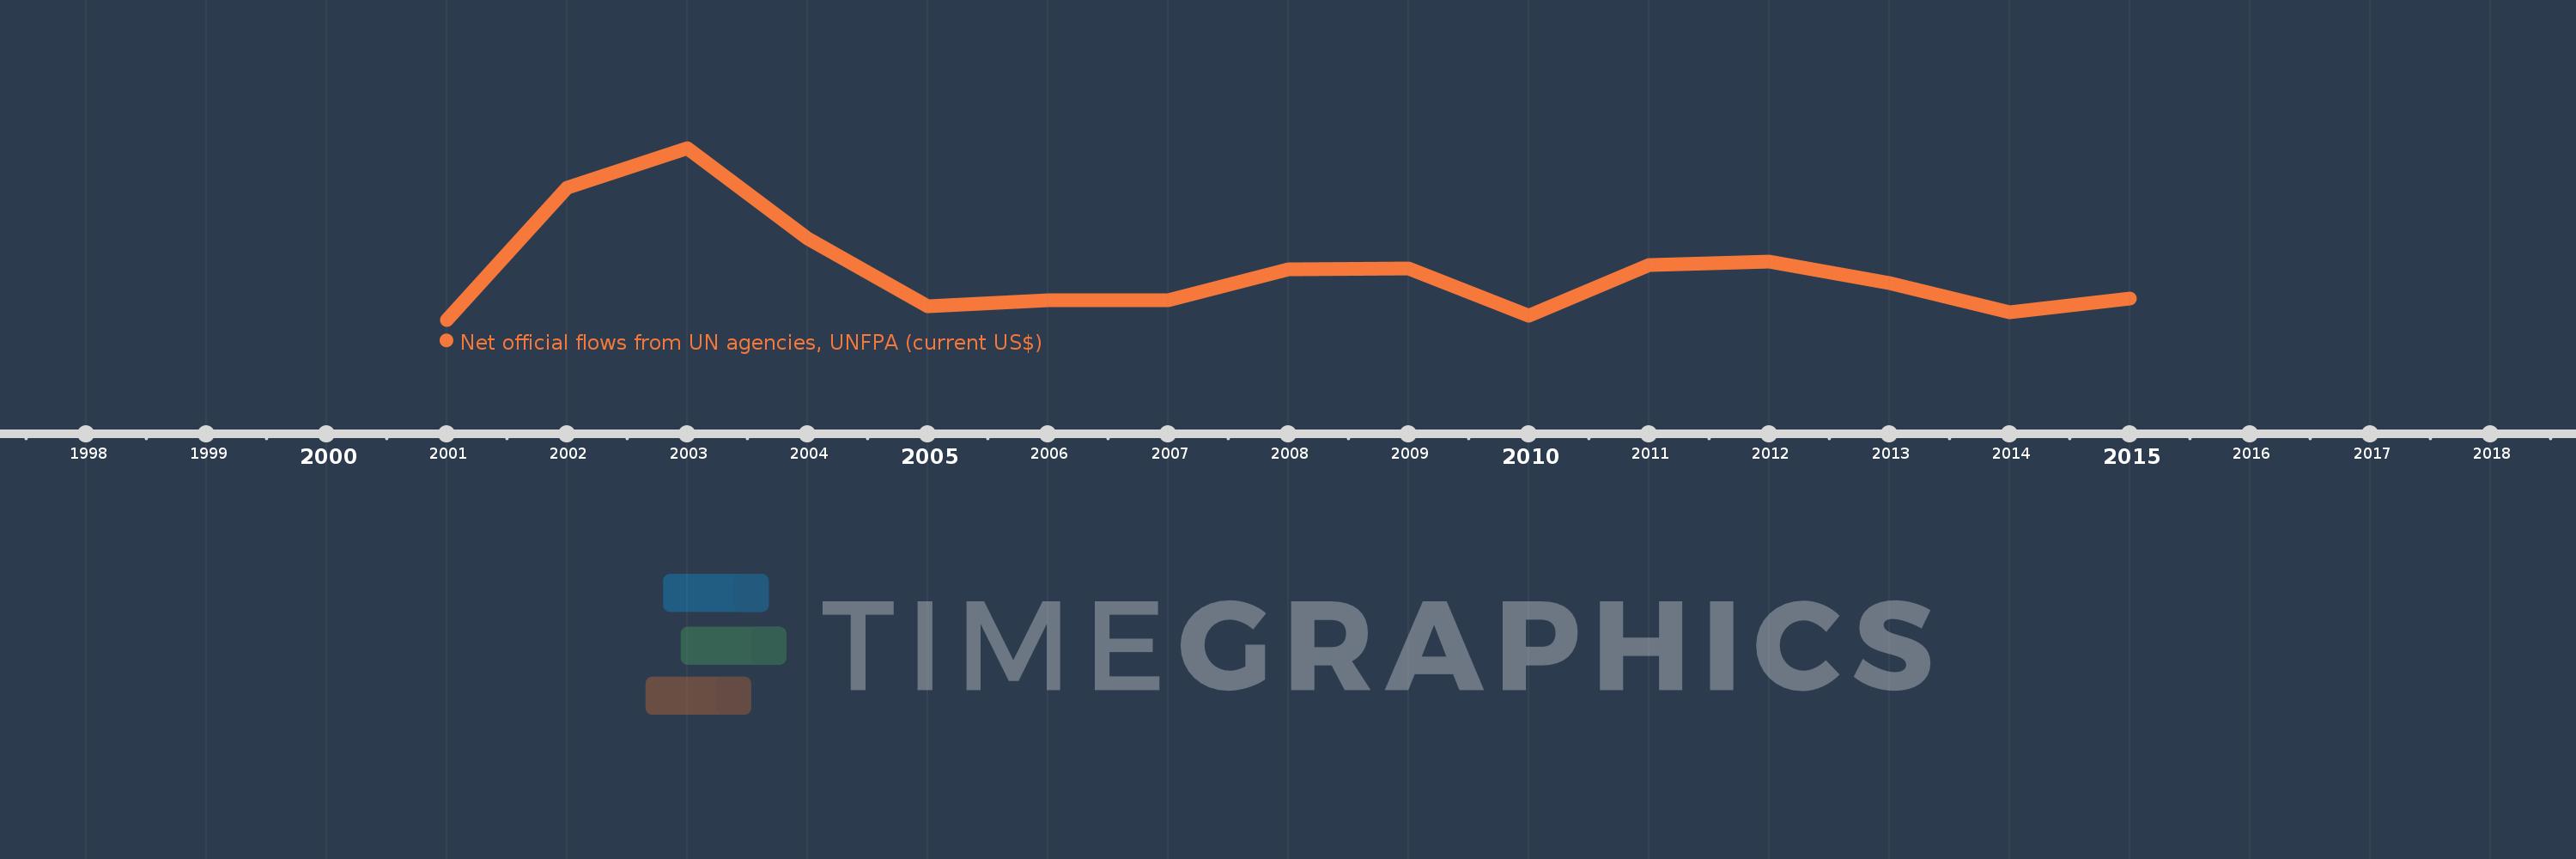
This timeline shows a graph from 2001 to 2015 of Serbia. No data until 2000. Number of actual observations by date: 15.
Source name:
World Development Indicators
Source organization:
Development Assistance Committee of the Organisation for Economic Co-operation and Development, Geographical Distribution of Financial Flows to Developing Countries, Development Co-operation Report, and International Development Statistics database. Data are available online at: www.oecd.org/dac/stats/idsonline.
Categories, topics:
Aid Effectiveness
Last updated:
apr 23, 2017
Indicators value changes by year
Meaning:
613.333K
Minimum:
70.0K
jan 1, 2001
Maximum:
2.01 mln
jan 1, 2003
At the date of observation
Value
Absolute change
Change from the previous value
jan 1, 2001
70.0K
+70.0K
0.0%
jan 1, 2002
1.56 mln
+1.49 mln
2.13K%
jan 1, 2003
2.01 mln
+450.0K
28.85%
jan 1, 2004
990.0K
-1.02 mln
-50.75%
jan 1, 2005
220.0K
-770.0K
-77.78%
jan 1, 2006
290.0K
+70.0K
31.82%
jan 1, 2007
290.0K
0.0
0.0%
jan 1, 2008
640.0K
+350.0K
120.69%
jan 1, 2009
650.0K
+10.0K
1.56%
jan 1, 2010
120.0K
-530.0K
-81.54%
jan 1, 2011
690.0K
+570.0K
475.0%
jan 1, 2012
730.0K
+40.0K
5.8%
jan 1, 2013
480.0K
-250.0K
-34.25%
jan 1, 2014
150.0K
-330.0K
-68.75%
jan 1, 2015
310.0K
+160.0K
106.67%
Ranking of countries by current statistics by years