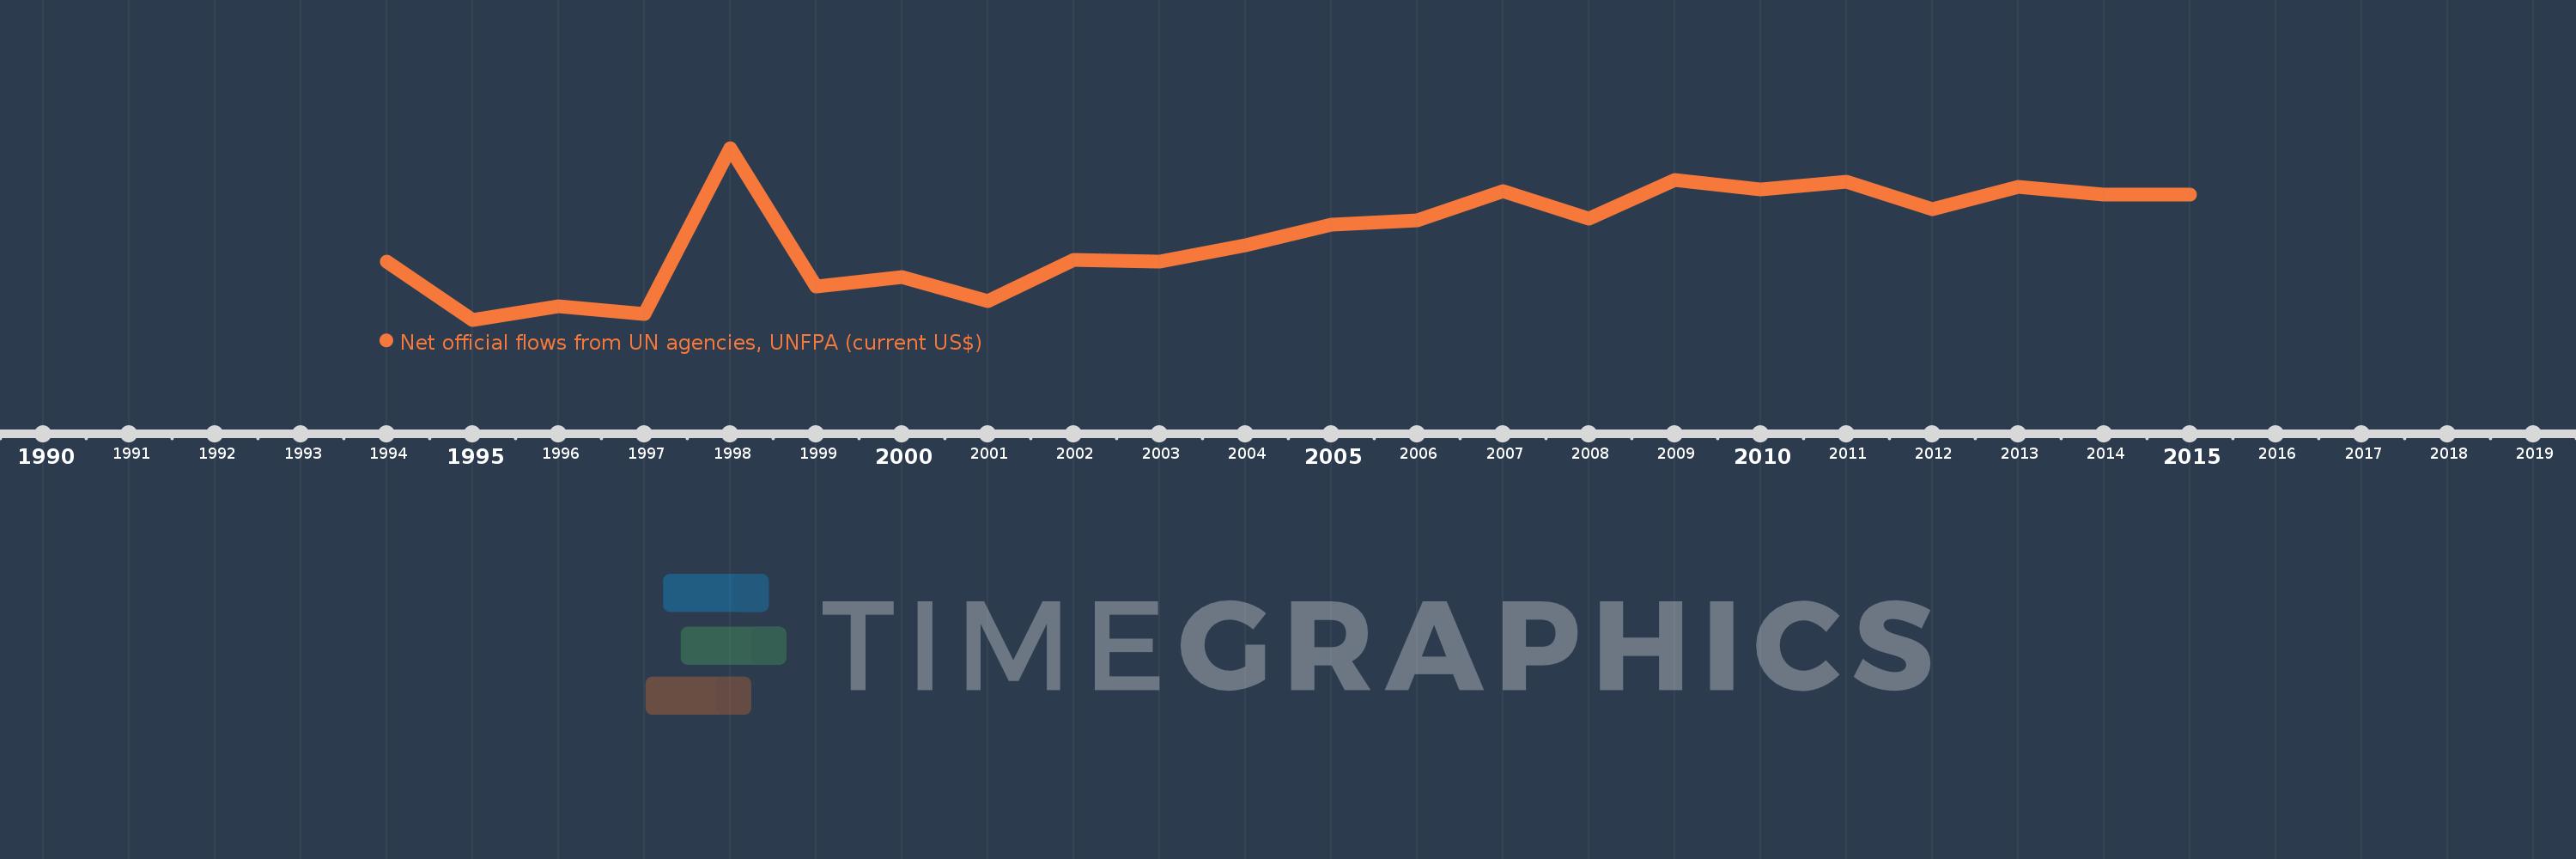
This timeline shows a graph from 1994 to 2015 of Georgia. No data until 1993. Number of actual observations by date: 22.
Source name:
World Development Indicators
Source organization:
Development Assistance Committee of the Organisation for Economic Co-operation and Development, Geographical Distribution of Financial Flows to Developing Countries, Development Co-operation Report, and International Development Statistics database. Data are available online at: www.oecd.org/dac/stats/idsonline.
Categories, topics:
Aid Effectiveness
Last updated:
apr 23, 2017
Indicators value changes by year
Meaning:
433.182K
Minimum:
-20.0K
jan 1, 1995
Maximum:
900.0K
jan 1, 1998
At the date of observation
Value
Absolute change
Change from the previous value
jan 1, 1994
290.0K
+290.0K
0.0%
jan 1, 1995
-20.0K
-310.0K
-106.9%
jan 1, 1996
50.0K
+70.0K
-350.0%
jan 1, 1997
10.0K
-40.0K
-80.0%
jan 1, 1998
900.0K
+890.0K
8.9K%
jan 1, 1999
160.0K
-740.0K
-82.22%
jan 1, 2000
210.0K
+50.0K
31.25%
jan 1, 2001
80.0K
-130.0K
-61.9%
jan 1, 2002
300.0K
+220.0K
275.0%
jan 1, 2003
290.0K
-10.0K
-3.33%
jan 1, 2004
380.0K
+90.0K
31.03%
jan 1, 2005
490.0K
+110.0K
28.95%
jan 1, 2006
510.0K
+20.0K
4.08%
jan 1, 2007
670.0K
+160.0K
31.37%
jan 1, 2008
520.0K
-150.0K
-22.39%
jan 1, 2009
730.0K
+210.0K
40.38%
jan 1, 2010
680.0K
-50.0K
-6.85%
jan 1, 2011
720.0K
+40.0K
5.88%
jan 1, 2012
570.0K
-150.0K
-20.83%
jan 1, 2013
690.0K
+120.0K
21.05%
jan 1, 2014
650.0K
-40.0K
-5.8%
jan 1, 2015
650.0K
0.0
0.0%
Ranking of countries by current statistics by years