33
/
AIzaSyB4mHJ5NPEv-XzF7P6NDYXjlkCWaeKw5bc
November 30, 2025
79979
Barbados
BRB
true
2
1
Stocks traded, total value (% of GDP)
2015,2014,2013,2012,2011,2002,2001,2000,1999,1998,1997,1996,1995,1994
Create a timeline
Public Timelines
For education
For educational institutions
For teachers
For students
Cabinet
For educational institutions
For teachers
For students
Open cabinet
FAQ
Close
Create a timeline
Public timelines
FAQ
About & Feedback
Terms
Privacy
FAQ
Support 24/7
Cabinet
Get premium
Donate
Download
Global statistics library
→
Barbados
→
Stocks traded, total value (% of GDP)
This statistics in other country:
Arab World
Argentina
Armenia
Australia
Austria
Bahrain
Bangladesh
Barbados
Belgium
Bermuda
Bolivia
Botswana
Brazil
Bulgaria
Canada
Cayman Islands
Central Europe and the Baltics
Channel Islands
Chile
China
Colombia
Costa Rica
Cote d'Ivoire
Croatia
Cyprus
Czech Republic
Denmark
Early-demographic dividend
East Asia & Pacific
East Asia & Pacific (excluding high income)
East Asia & Pacific (IDA & IBRD countries)
Ecuador
Egypt, Arab Rep.
El Salvador
Estonia
Euro area
Europe & Central Asia
Europe & Central Asia (excluding high income)
Europe & Central Asia (IDA & IBRD countries)
European Union
Fiji
Finland
France
Georgia
Germany
Ghana
Greece
Guyana
High income
Hong Kong SAR, China
Hungary
IBRD only
Iceland
IDA & IBRD total
IDA blend
IDA total
India
Indonesia
Iran, Islamic Rep.
Ireland
Israel
Italy
Jamaica
Japan
Jordan
Kazakhstan
Kenya
Korea, Rep.
Kuwait
Kyrgyz Republic
Late-demographic dividend
Latin America & Caribbean
Latin America & Caribbean (excluding high income)
Latin America & the Caribbean (IDA & IBRD countries)
Latvia
Lebanon
Lithuania
Low & middle income
Lower middle income
Luxembourg
Macedonia, FYR
Malawi
Malaysia
Malta
Mauritius
Mexico
Middle East & North Africa
Middle East & North Africa (excluding high income)
Middle East & North Africa (IDA & IBRD countries)
Middle income
Moldova
Mongolia
Montenegro
Morocco
Namibia
Netherlands
New Zealand
Nigeria
North America
Norway
OECD members
Oman
Other small states
Pakistan
Panama
Papua New Guinea
Paraguay
Peru
Philippines
Poland
Portugal
Post-demographic dividend
Qatar
Romania
Russian Federation
Saudi Arabia
Serbia
Seychelles
Singapore
Slovak Republic
Slovenia
South Africa
South Asia
South Asia (IDA & IBRD)
Spain
Sri Lanka
St. Kitts and Nevis
Sub-Saharan Africa
Sub-Saharan Africa (excluding high income)
Sub-Saharan Africa (IDA & IBRD countries)
Swaziland
Sweden
Switzerland
Tanzania
Thailand
Trinidad and Tobago
Tunisia
Turkey
Uganda
Ukraine
United Arab Emirates
United Kingdom
United States
Upper middle income
Uruguay
Uzbekistan
Venezuela, RB
Vietnam
West Bank and Gaza
World
Zambia
Zimbabwe
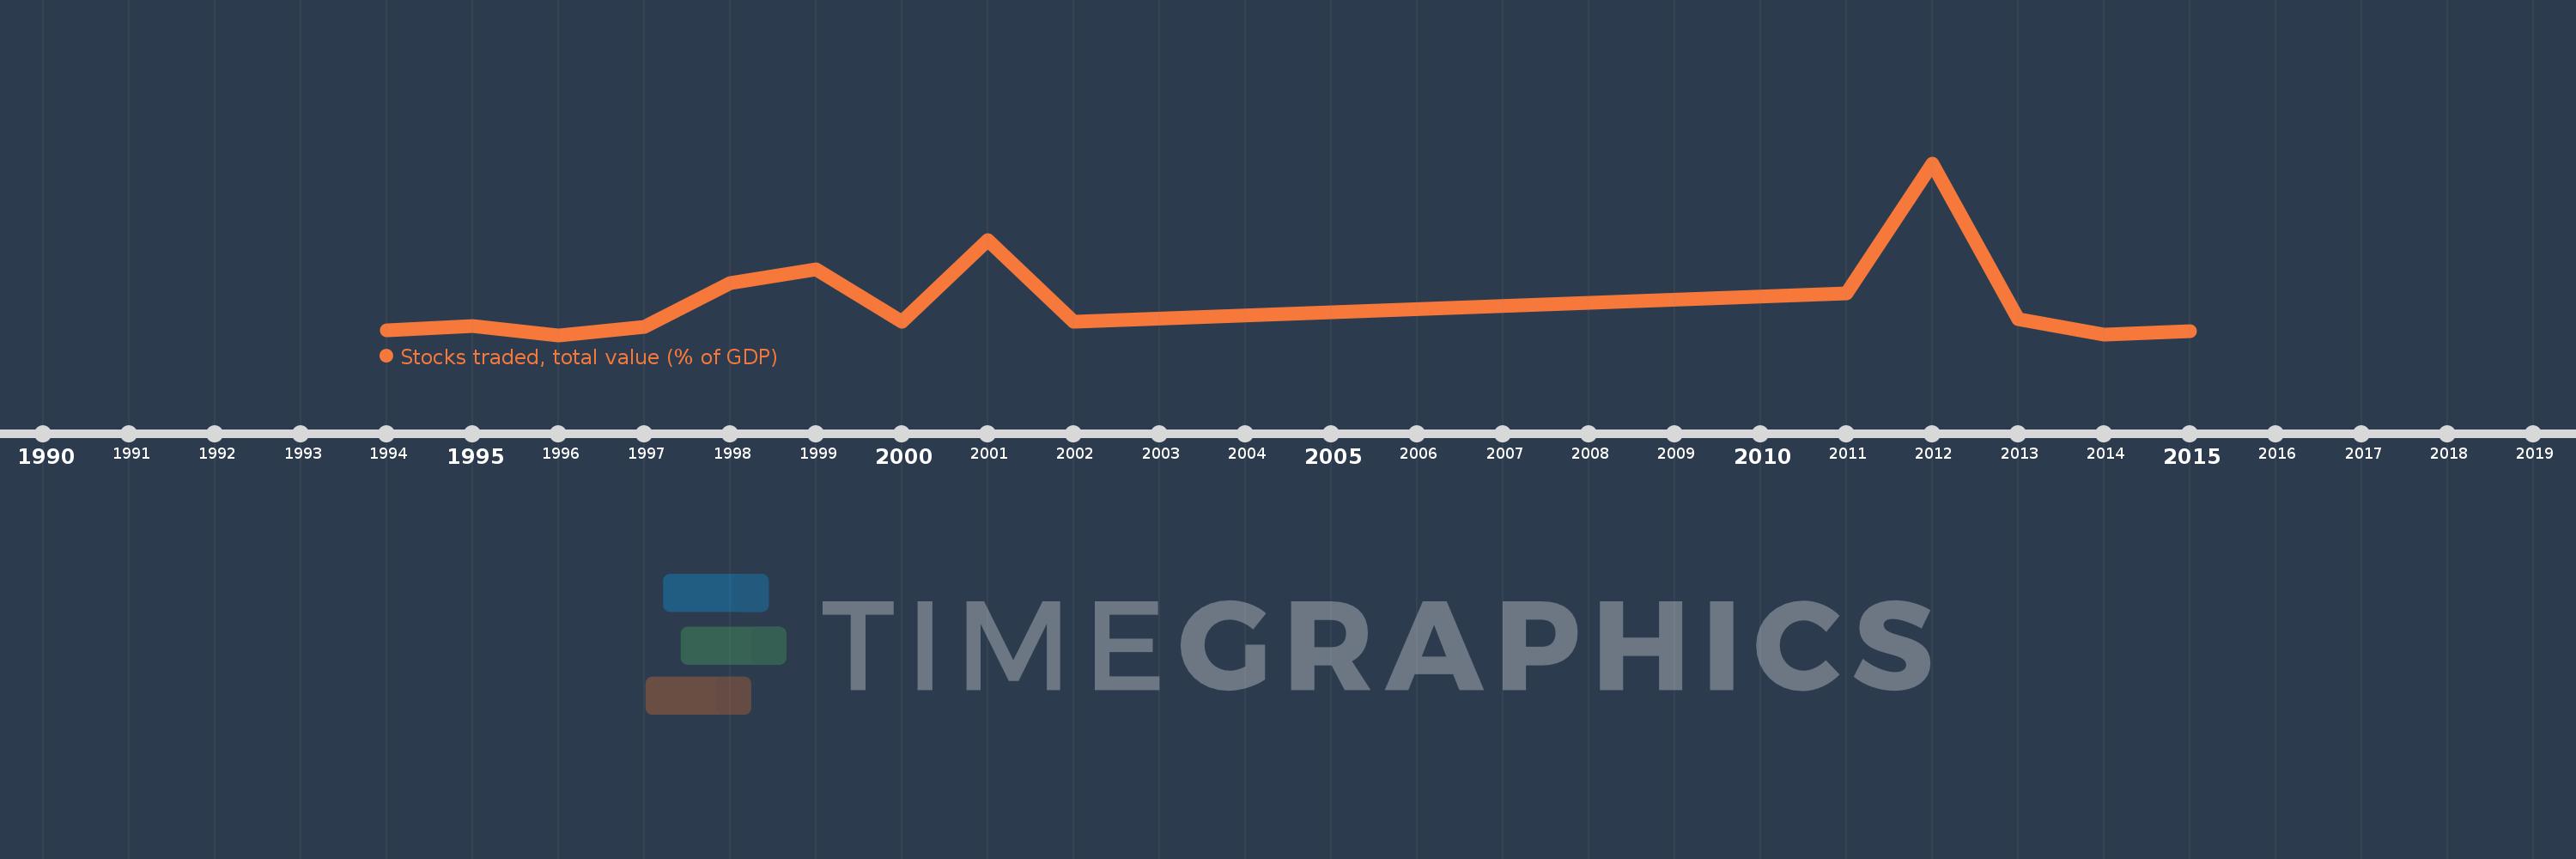
Timeline:
This timeline shows a graph from
1994
to
2015
of Barbados. No data until
1993
. Number of actual observations by date:
14
.
Source name:
World Development Indicators
Source organization:
World Federation of Exchanges database.
Categories, topics:
Financial Sector
Last updated:
apr 23, 2017
Indicators value changes by year
Meaning:
0.661
Minimum:
0.137
jan 1, 1996
Maximum:
2.688
jan 1, 2012
At the date of observation
Value
Absolute change
Change from the previous value
jan 1, 1994
0.213
+0.213
0.0%
jan 1, 1995
0.265
+0.052
24.25%
jan 1, 1996
0.137
-0.127
-48.11%
jan 1, 1997
0.255
+0.118
85.76%
jan 1, 1998
0.909
+0.653
255.86%
jan 1, 1999
1.107
+0.198
21.84%
jan 1, 2000
0.338
-0.769
-69.45%
jan 1, 2001
1.541
+1.203
355.46%
jan 1, 2002
0.33
-1.21
-78.55%
jan 1, 2011
0.756
+0.425
128.63%
jan 1, 2012
2.688
+1.933
255.78%
jan 1, 2013
0.369
-2.319
-86.26%
jan 1, 2014
0.146
-0.223
-60.36%
jan 1, 2015
0.2
+0.053
36.51%
Ranking of countries by current statistics by years
About & Feedback
Terms
Privacy
FAQ
Support 24/7
Cabinet
Get premium
Donate
The service accepts bank transfer (ACH, Wire) or cards (Visa, MasterCard, etc). Processed by Stripe.
Secured with SSL