Download This statistics in other country:
Timeline:
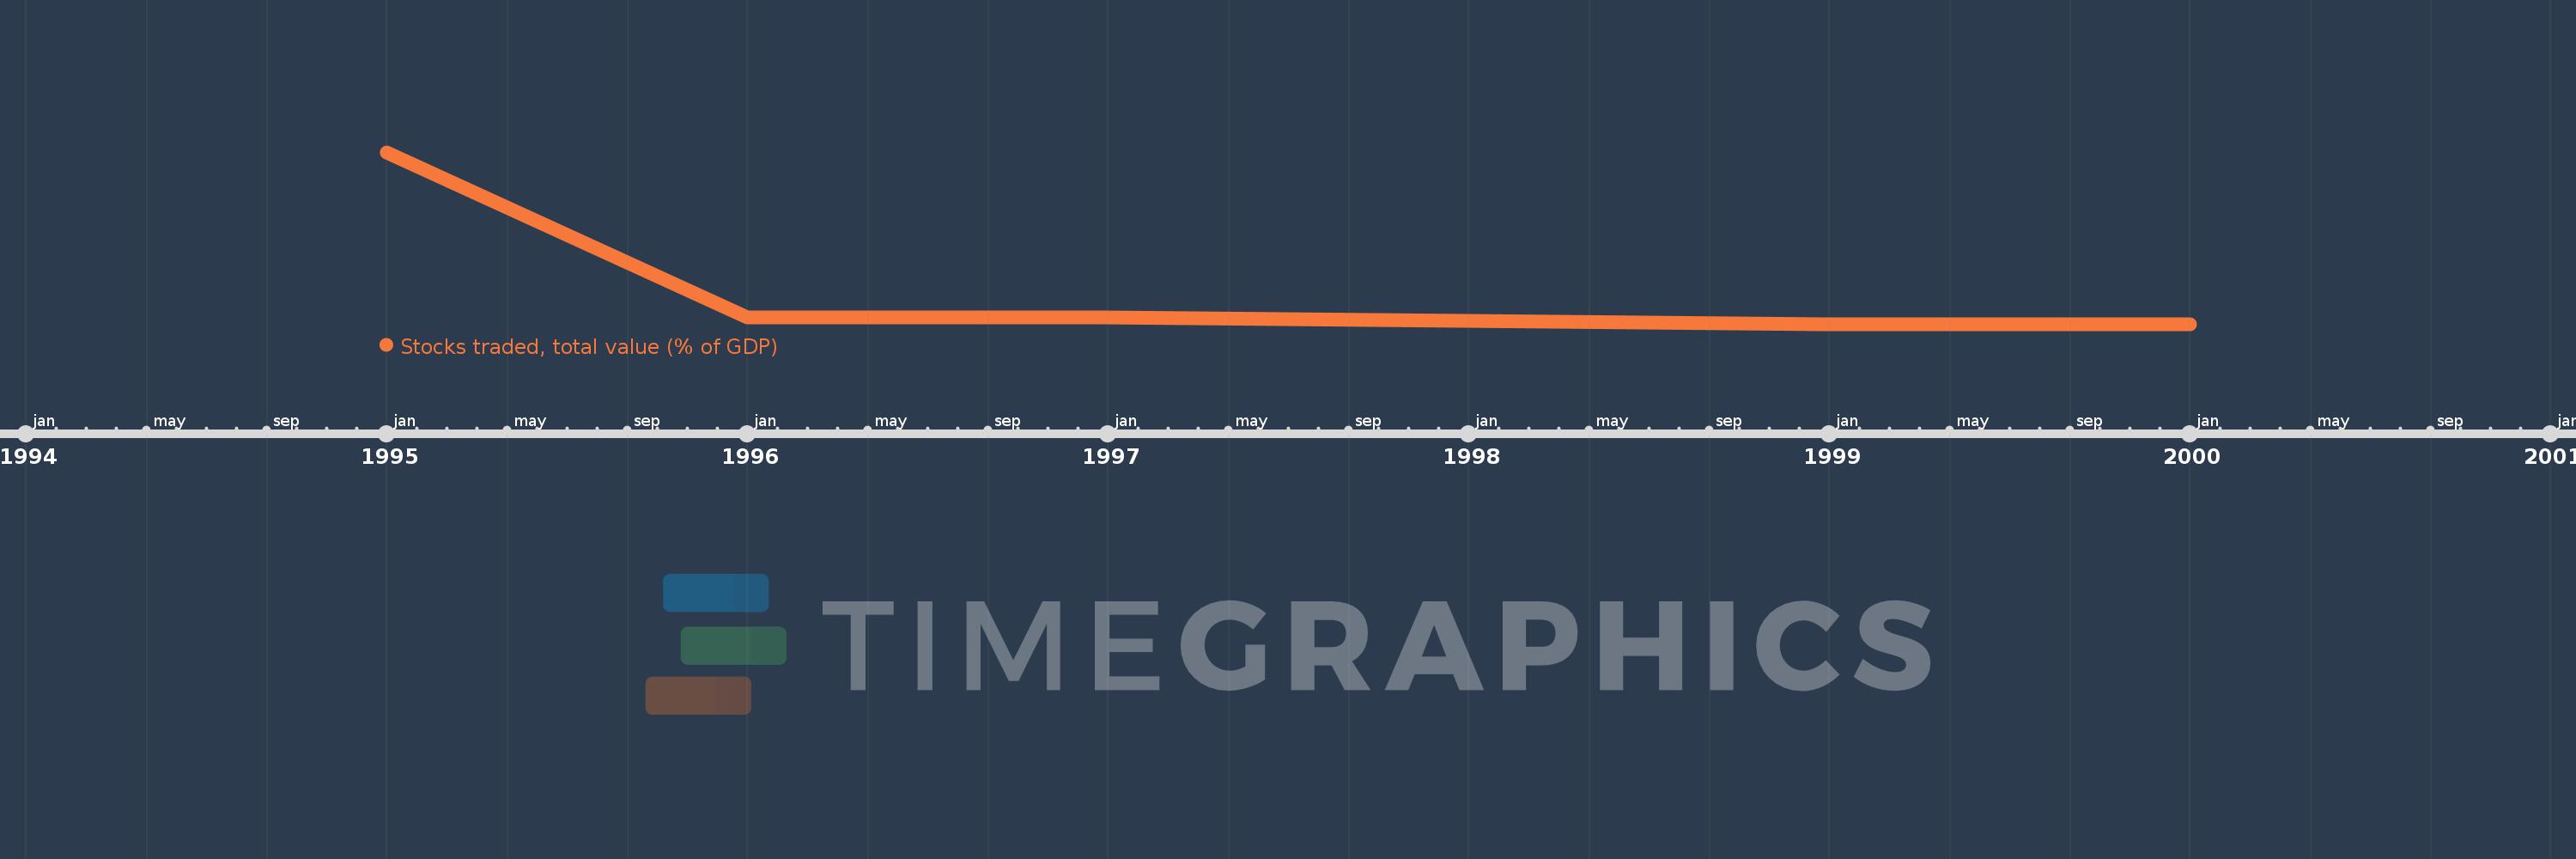
This timeline shows a graph from 1995 to 2000 of Uruguay. No data until 1994. Number of actual observations by date: 5.
Source name:
World Development Indicators
Source organization:
World Federation of Exchanges database.
Categories, topics:
Financial Sector
Last updated:
apr 23, 2017
Indicators value changes by year
At the date of observation
Value
Absolute change
Change from the previous value
jan 1, 1995
0.053
+0.053
0.0%
jan 1, 1996
0.003
-0.05
-94.55%
jan 1, 1997
0.003
0.0
-7.62%
jan 1, 1999
0.001
-0.002
-61.8%
jan 1, 2000
0.001
0.0
-47.08%
Ranking of countries by current statistics by years