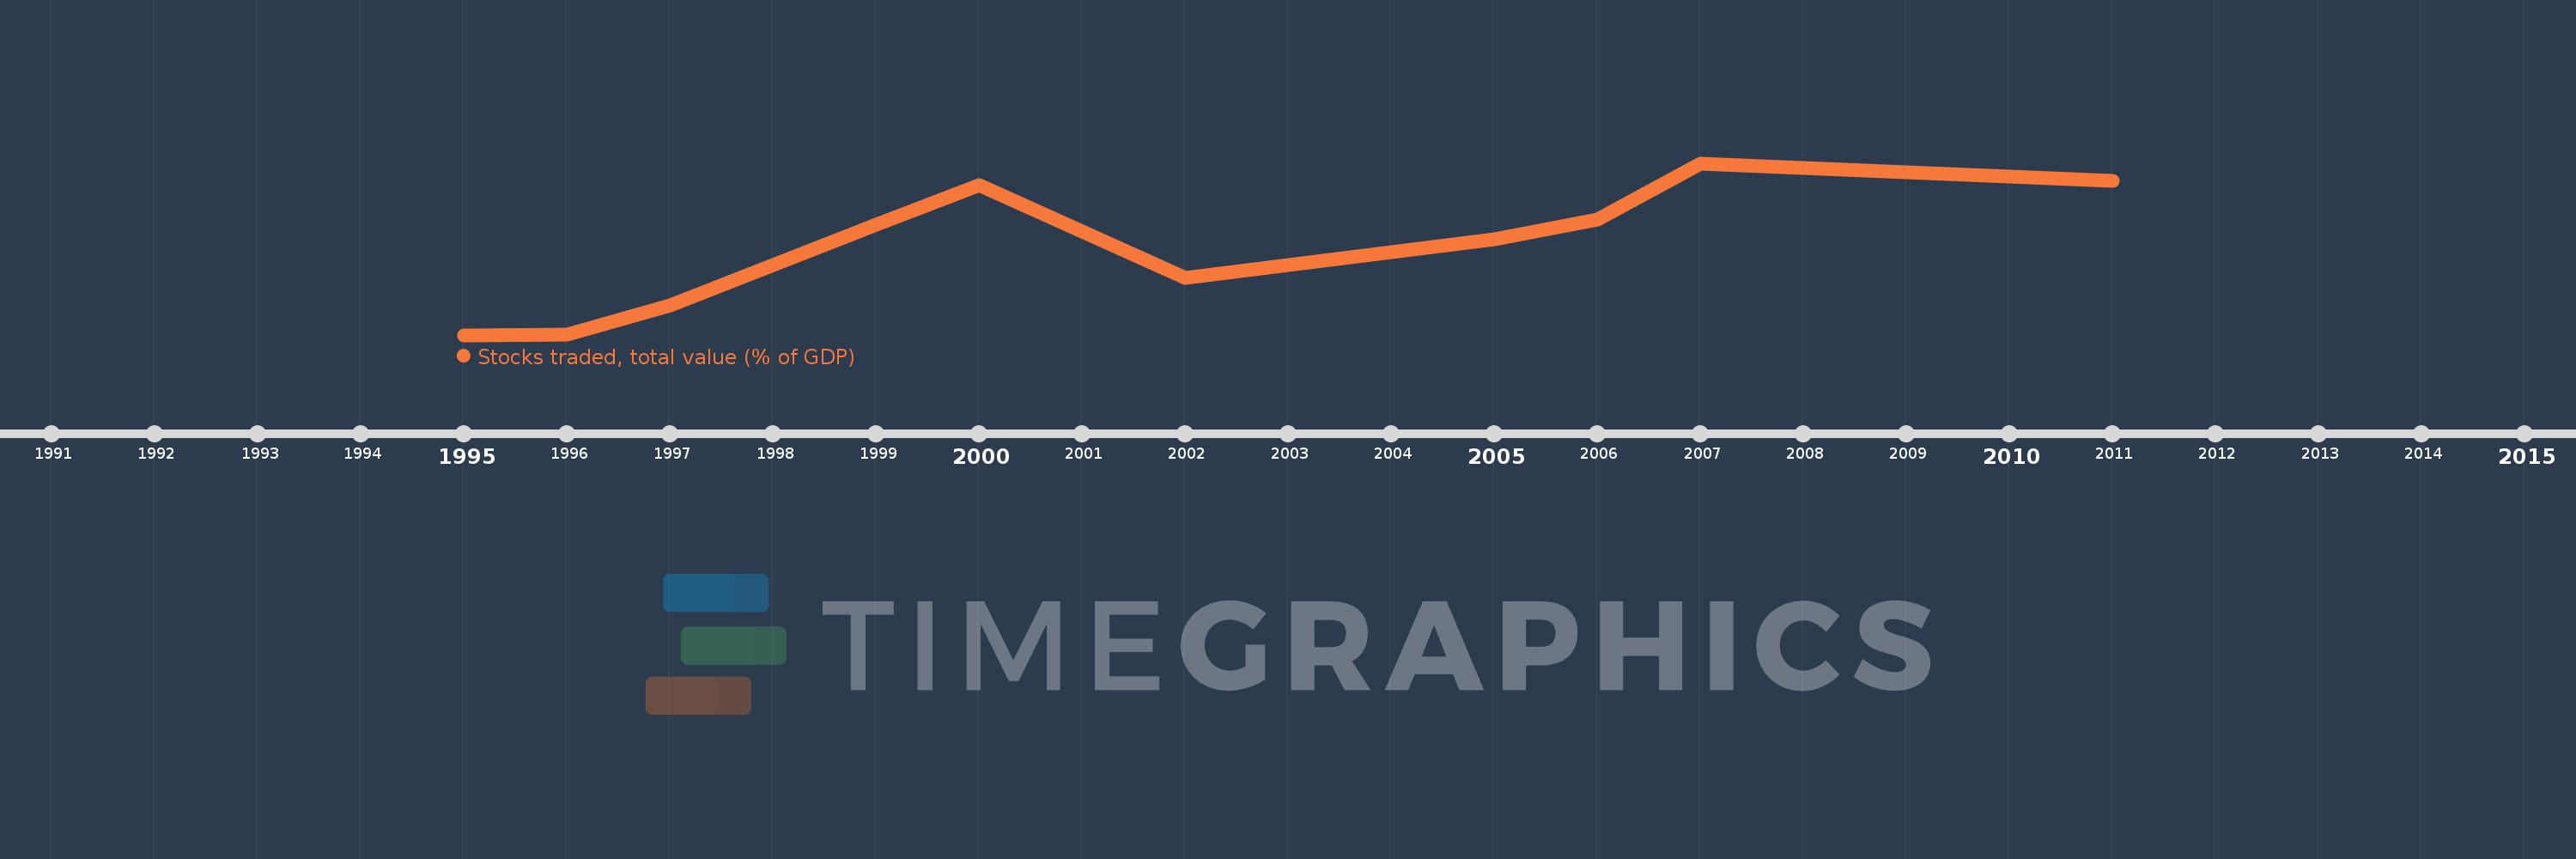
This timeline shows a graph from 1995 to 2011 of Sub-Saharan Africa (excluding high income). No data until 1994. Number of actual observations by date: 10.
Source name:
World Development Indicators
Source organization:
World Federation of Exchanges database.
Categories, topics:
Financial Sector
Last updated:
apr 23, 2017
Indicators value changes by year
Meaning:
20.836
Minimum:
6.852
jan 1, 1995
Maximum:
34.044
jan 1, 2007
At the date of observation
Value
Absolute change
Change from the previous value
jan 1, 1995
6.852
+6.852
0.0%
jan 1, 1996
6.936
+0.084
1.23%
jan 1, 1997
11.568
+4.632
66.77%
jan 1, 1999
24.313
+12.745
110.18%
jan 1, 2000
30.512
+6.199
25.5%
jan 1, 2002
15.872
-14.641
-47.98%
jan 1, 2005
21.974
+6.102
38.45%
jan 1, 2006
25.103
+3.129
14.24%
jan 1, 2007
34.044
+8.941
35.62%
jan 1, 2011
31.191
-2.853
-8.38%
Ranking of countries by current statistics by years