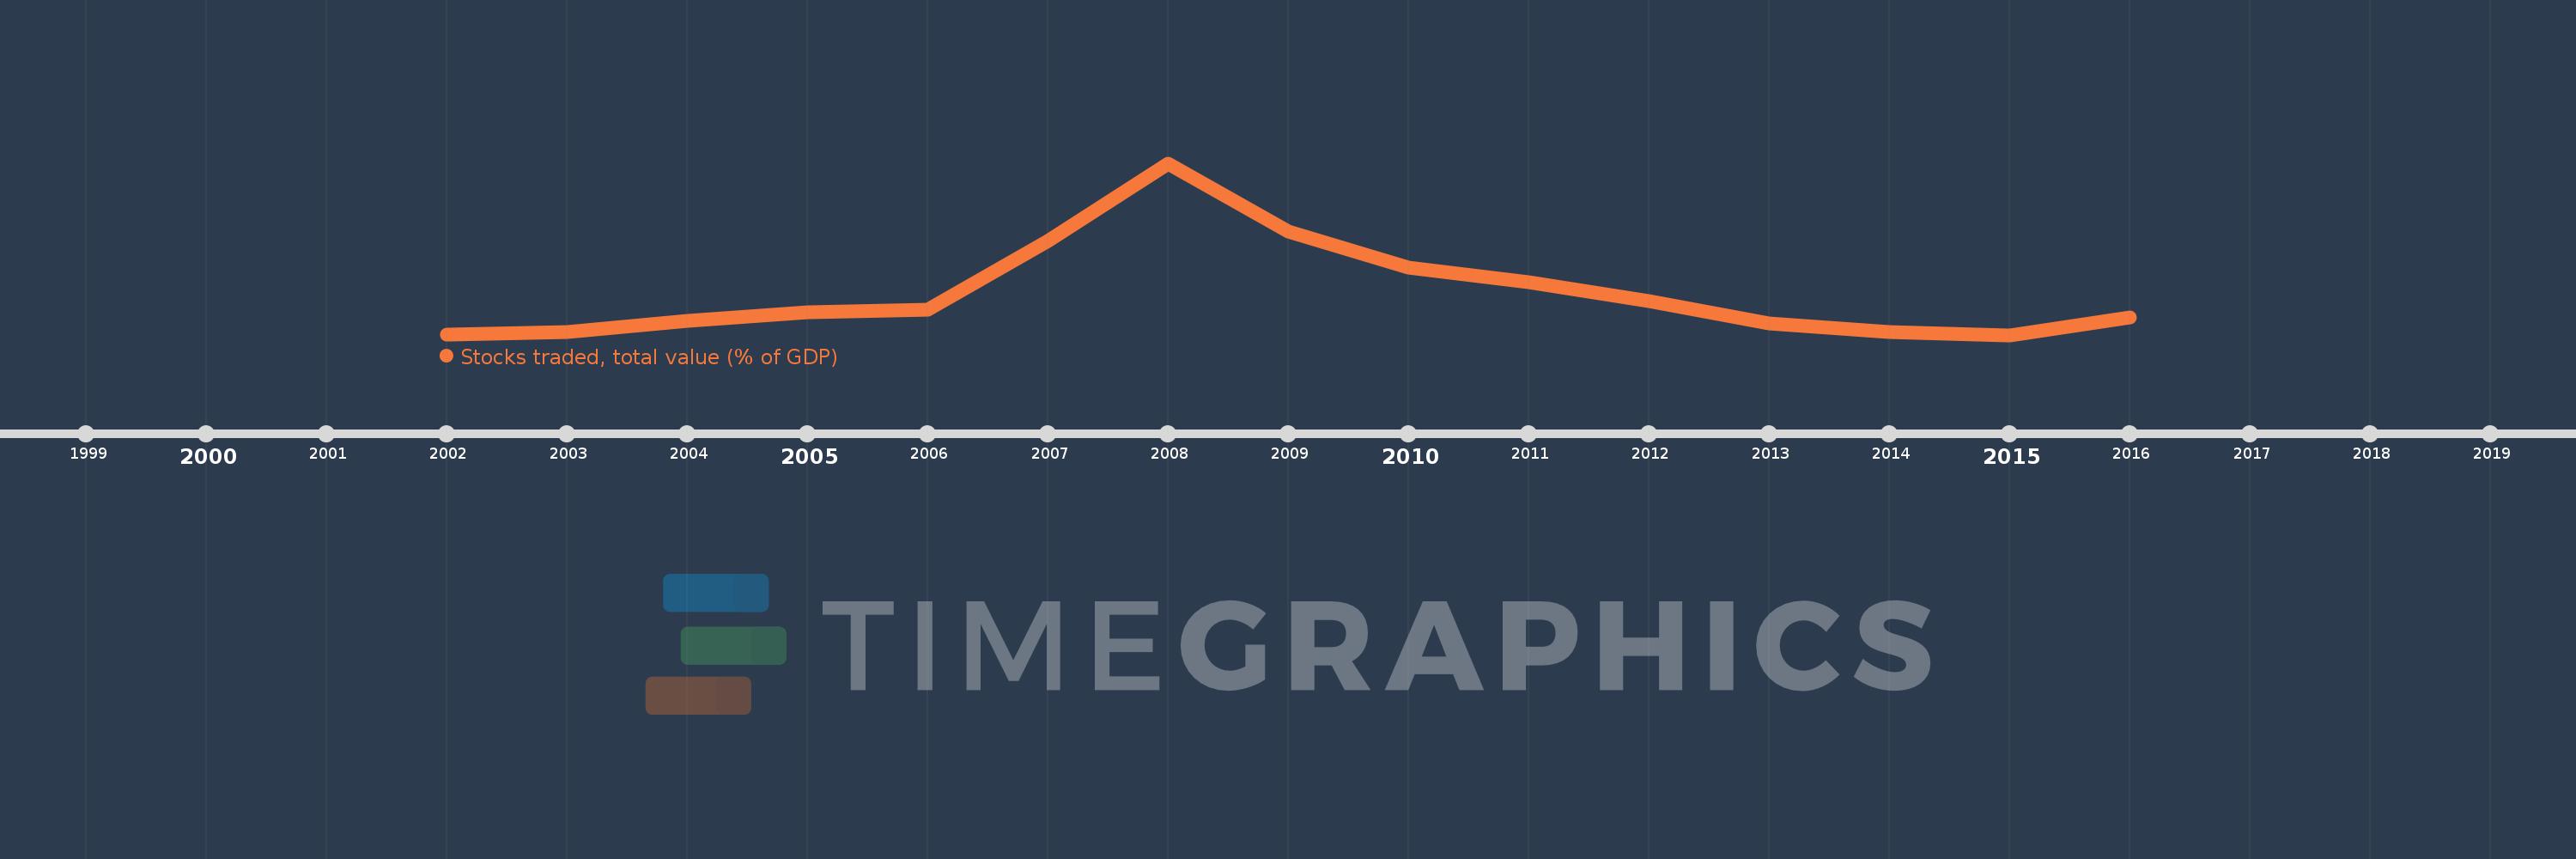
This timeline shows a graph from 2002 to 2016 of Europe & Central Asia (excluding high income). No data until 2001. Number of actual observations by date: 15.
Source name:
World Development Indicators
Source organization:
World Federation of Exchanges database.
Categories, topics:
Financial Sector
Last updated:
apr 23, 2017
Indicators value changes by year
Meaning:
28.39
Minimum:
15.628
jan 1, 2015
Maximum:
68.549
jan 1, 2008
At the date of observation
Value
Absolute change
Change from the previous value
jan 1, 2002
15.889
+15.889
0.0%
jan 1, 2003
16.511
+0.622
3.91%
jan 1, 2004
20.096
+3.584
21.71%
jan 1, 2005
22.636
+2.541
12.64%
jan 1, 2006
23.493
+0.856
3.78%
jan 1, 2007
44.533
+21.04
89.56%
jan 1, 2008
68.549
+24.016
53.93%
jan 1, 2009
47.468
-21.081
-30.75%
jan 1, 2010
36.307
-11.16
-23.51%
jan 1, 2011
31.943
-4.365
-12.02%
jan 1, 2012
25.973
-5.97
-18.69%
jan 1, 2013
19.332
-6.641
-25.57%
jan 1, 2014
16.461
-2.871
-14.85%
jan 1, 2015
15.628
-0.834
-5.06%
jan 1, 2016
21.028
+5.4
34.55%
Ranking of countries by current statistics by years