Download This statistics in other country:
Timeline:
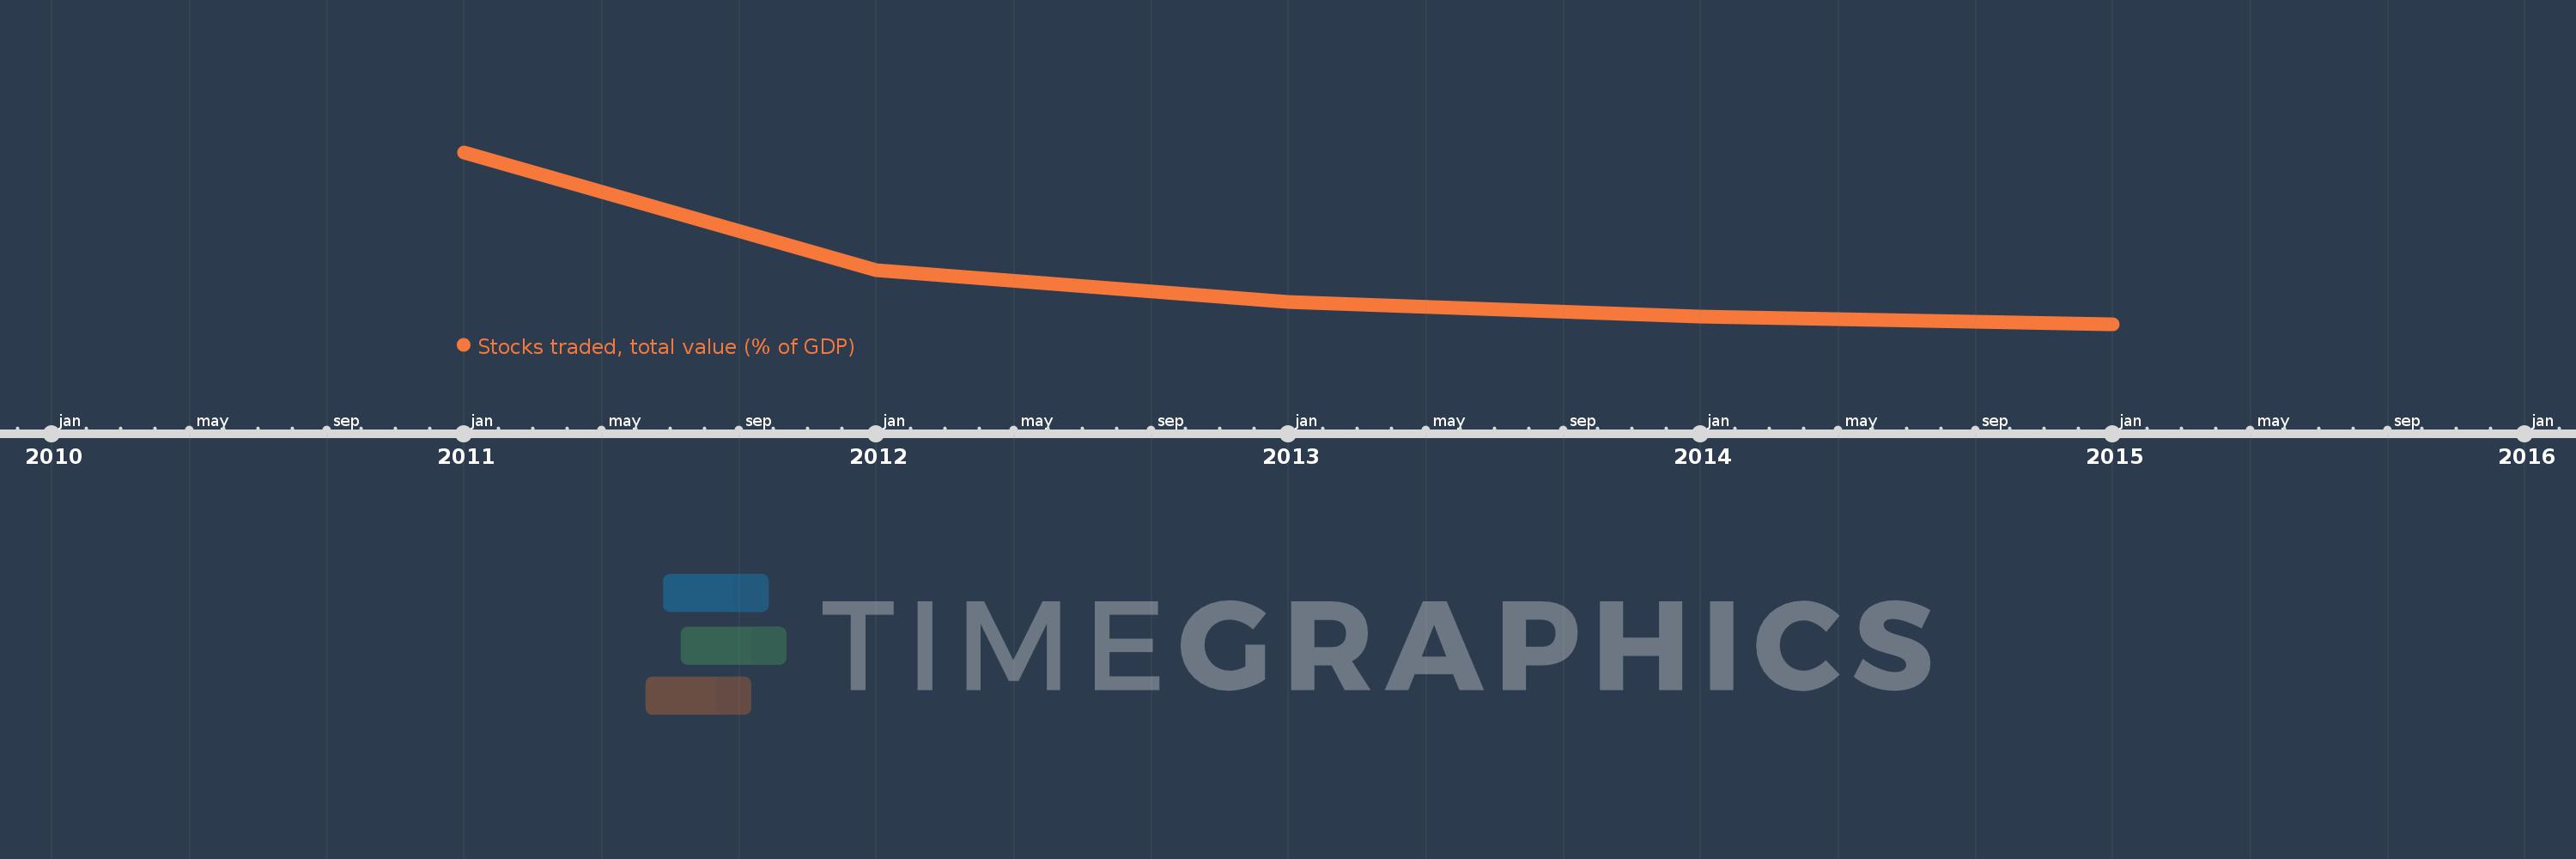
This timeline shows a graph from 2011 to 2015 of Ukraine. No data until 2010. Number of actual observations by date: 5.
Source name:
World Development Indicators
Source organization:
World Federation of Exchanges database.
Categories, topics:
Financial Sector
Last updated:
apr 23, 2017
Indicators value changes by year
At the date of observation
Value
Absolute change
Change from the previous value
jan 1, 2011
2.087
+2.087
0.0%
jan 1, 2012
0.722
-1.365
-65.42%
jan 1, 2013
0.355
-0.366
-50.75%
jan 1, 2014
0.18
-0.176
-49.42%
jan 1, 2015
0.092
-0.088
-49.09%
Ranking of countries by current statistics by years