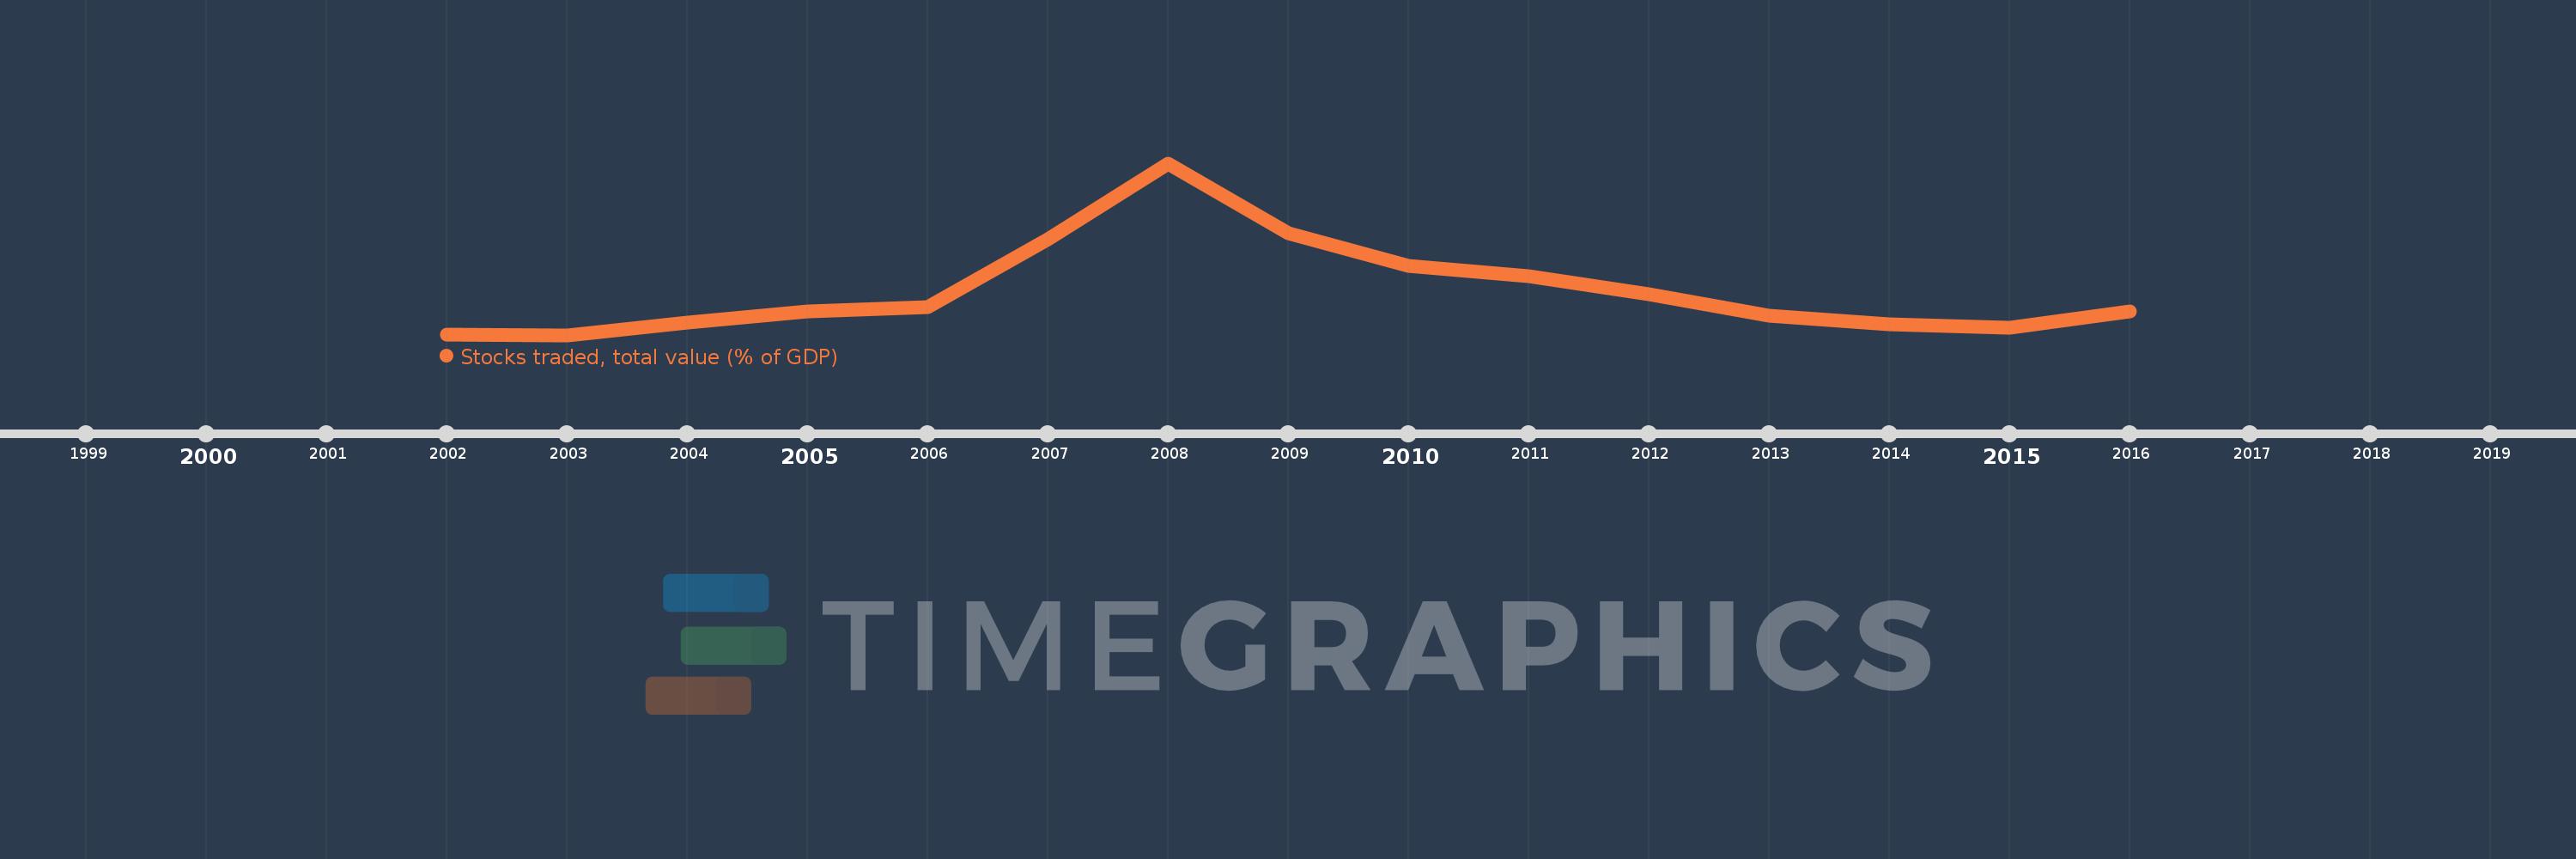
This timeline shows a graph from 2002 to 2016 of Europe & Central Asia (IDA & IBRD countries). No data until 2001. Number of actual observations by date: 15.
Source name:
World Development Indicators
Source organization:
World Federation of Exchanges database.
Categories, topics:
Financial Sector
Last updated:
apr 23, 2017
Indicators value changes by year
Meaning:
25.023
Minimum:
12.87
jan 1, 2003
Maximum:
60.125
jan 1, 2008
At the date of observation
Value
Absolute change
Change from the previous value
jan 1, 2002
12.955
+12.955
0.0%
jan 1, 2003
12.87
-0.085
-0.66%
jan 1, 2004
16.367
+3.497
27.18%
jan 1, 2005
19.336
+2.97
18.14%
jan 1, 2006
20.486
+1.15
5.94%
jan 1, 2007
39.111
+18.625
90.91%
jan 1, 2008
60.125
+21.014
53.73%
jan 1, 2009
40.88
-19.245
-32.01%
jan 1, 2010
31.85
-9.03
-22.09%
jan 1, 2011
28.958
-2.892
-9.08%
jan 1, 2012
24.05
-4.908
-16.95%
jan 1, 2013
18.215
-5.835
-24.26%
jan 1, 2014
15.936
-2.28
-12.52%
jan 1, 2015
14.934
-1.001
-6.28%
jan 1, 2016
19.269
+4.334
29.02%
Ranking of countries by current statistics by years