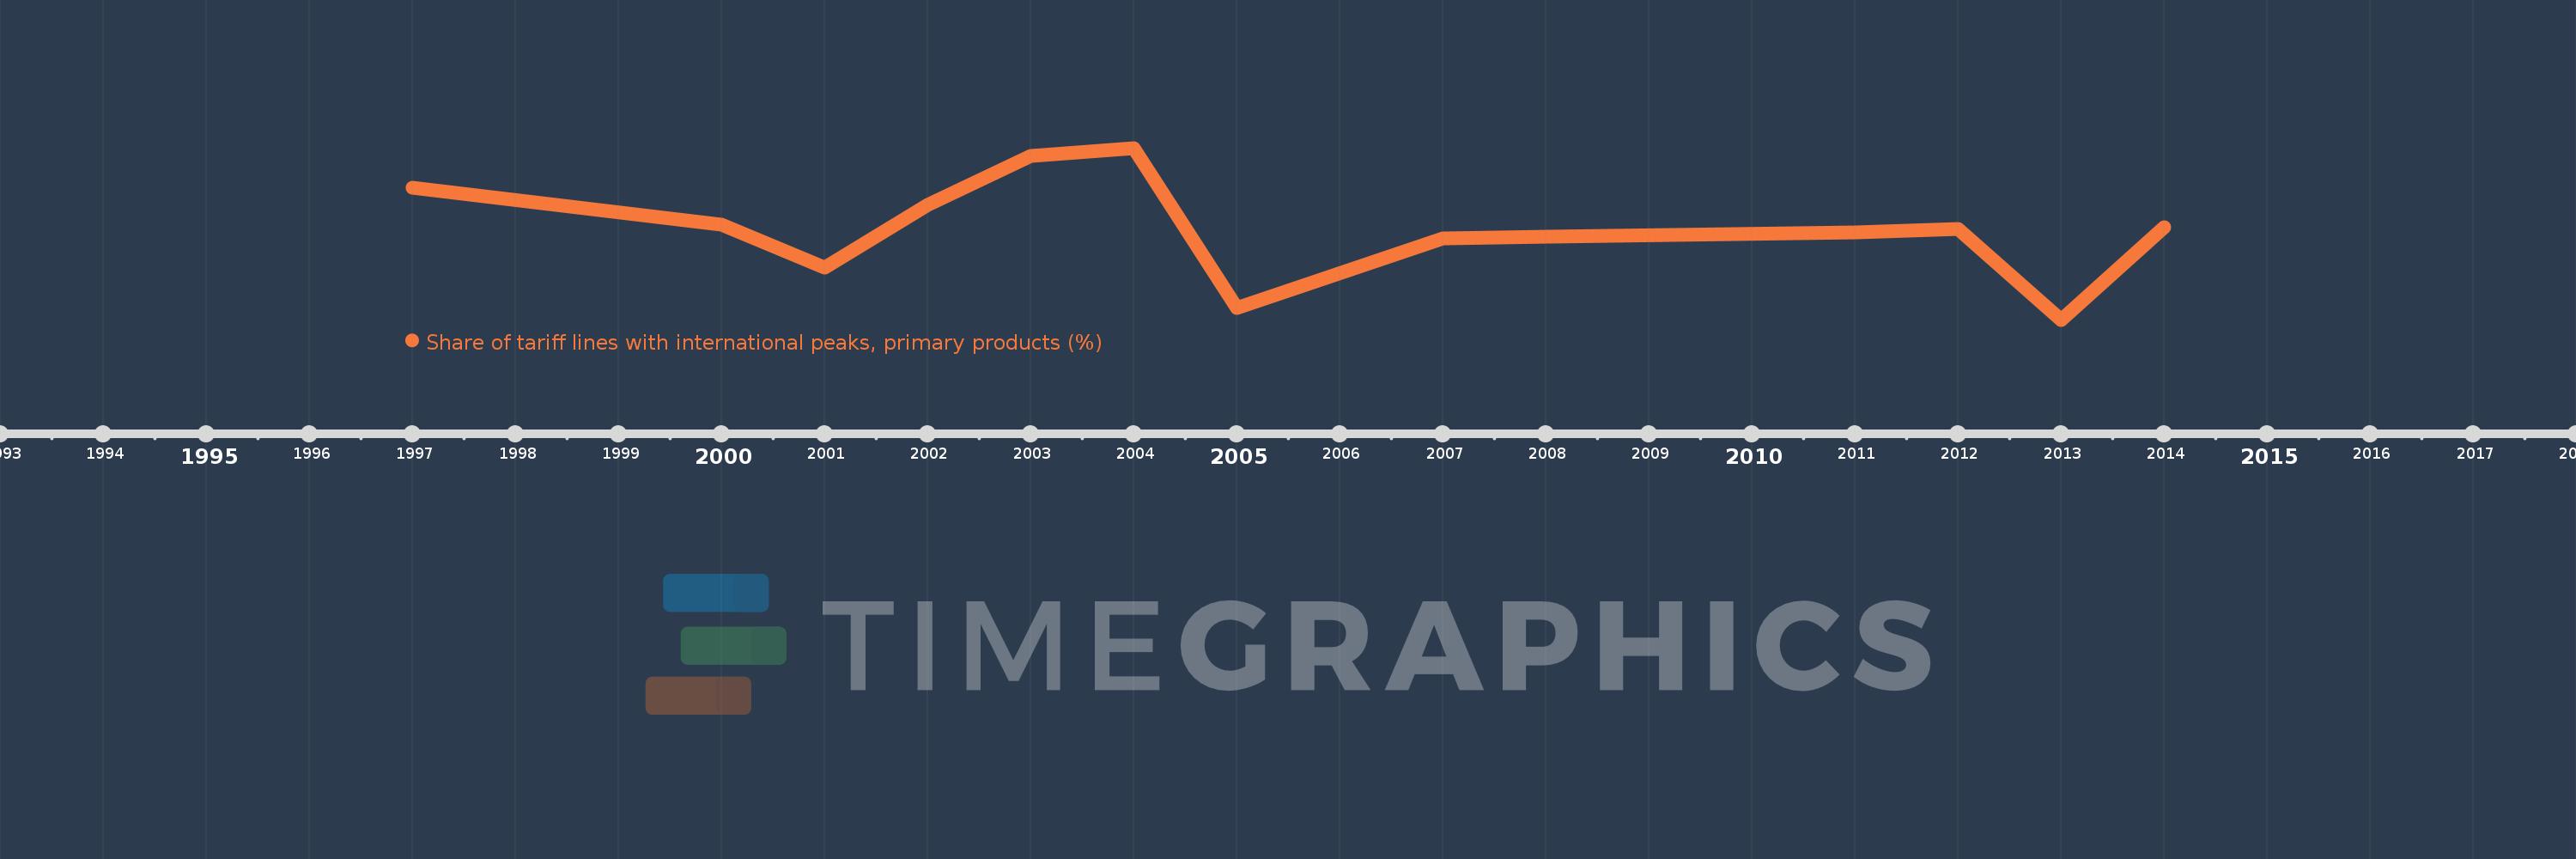
This timeline shows a graph from 1997 to 2014 of Barbados. No data until 1996. Number of actual observations by date: 13.
Source name:
World Development Indicators
Source organization:
World Bank staff estimates using the World Integrated Trade Solution system, based on data from United Nations Conference on Trade and Development's Trade Analysis and Information System (TRAINS) database.
Categories, topics:
Private Sector, Trade
Last updated:
apr 23, 2017
Indicators value changes by year
Meaning:
51.366
Minimum:
39.581
jan 1, 2013
Maximum:
61.922
jan 1, 2004
At the date of observation
Value
Absolute change
Change from the previous value
jan 1, 1997
56.771
+56.771
0.0%
jan 1, 2000
52.001
-4.77
-8.4%
jan 1, 2001
46.376
-5.625
-10.82%
jan 1, 2002
54.549
+8.173
17.62%
jan 1, 2003
60.864
+6.314
11.58%
jan 1, 2004
61.922
+1.058
1.74%
jan 1, 2005
41.152
-20.77
-33.54%
jan 1, 2007
50.106
+8.954
21.76%
jan 1, 2008
50.389
+0.283
0.56%
jan 1, 2011
50.99
+0.602
1.19%
jan 1, 2012
51.404
+0.414
0.81%
jan 1, 2013
39.581
-11.823
-23.0%
jan 1, 2014
51.655
+12.074
30.5%
Ranking of countries by current statistics by years