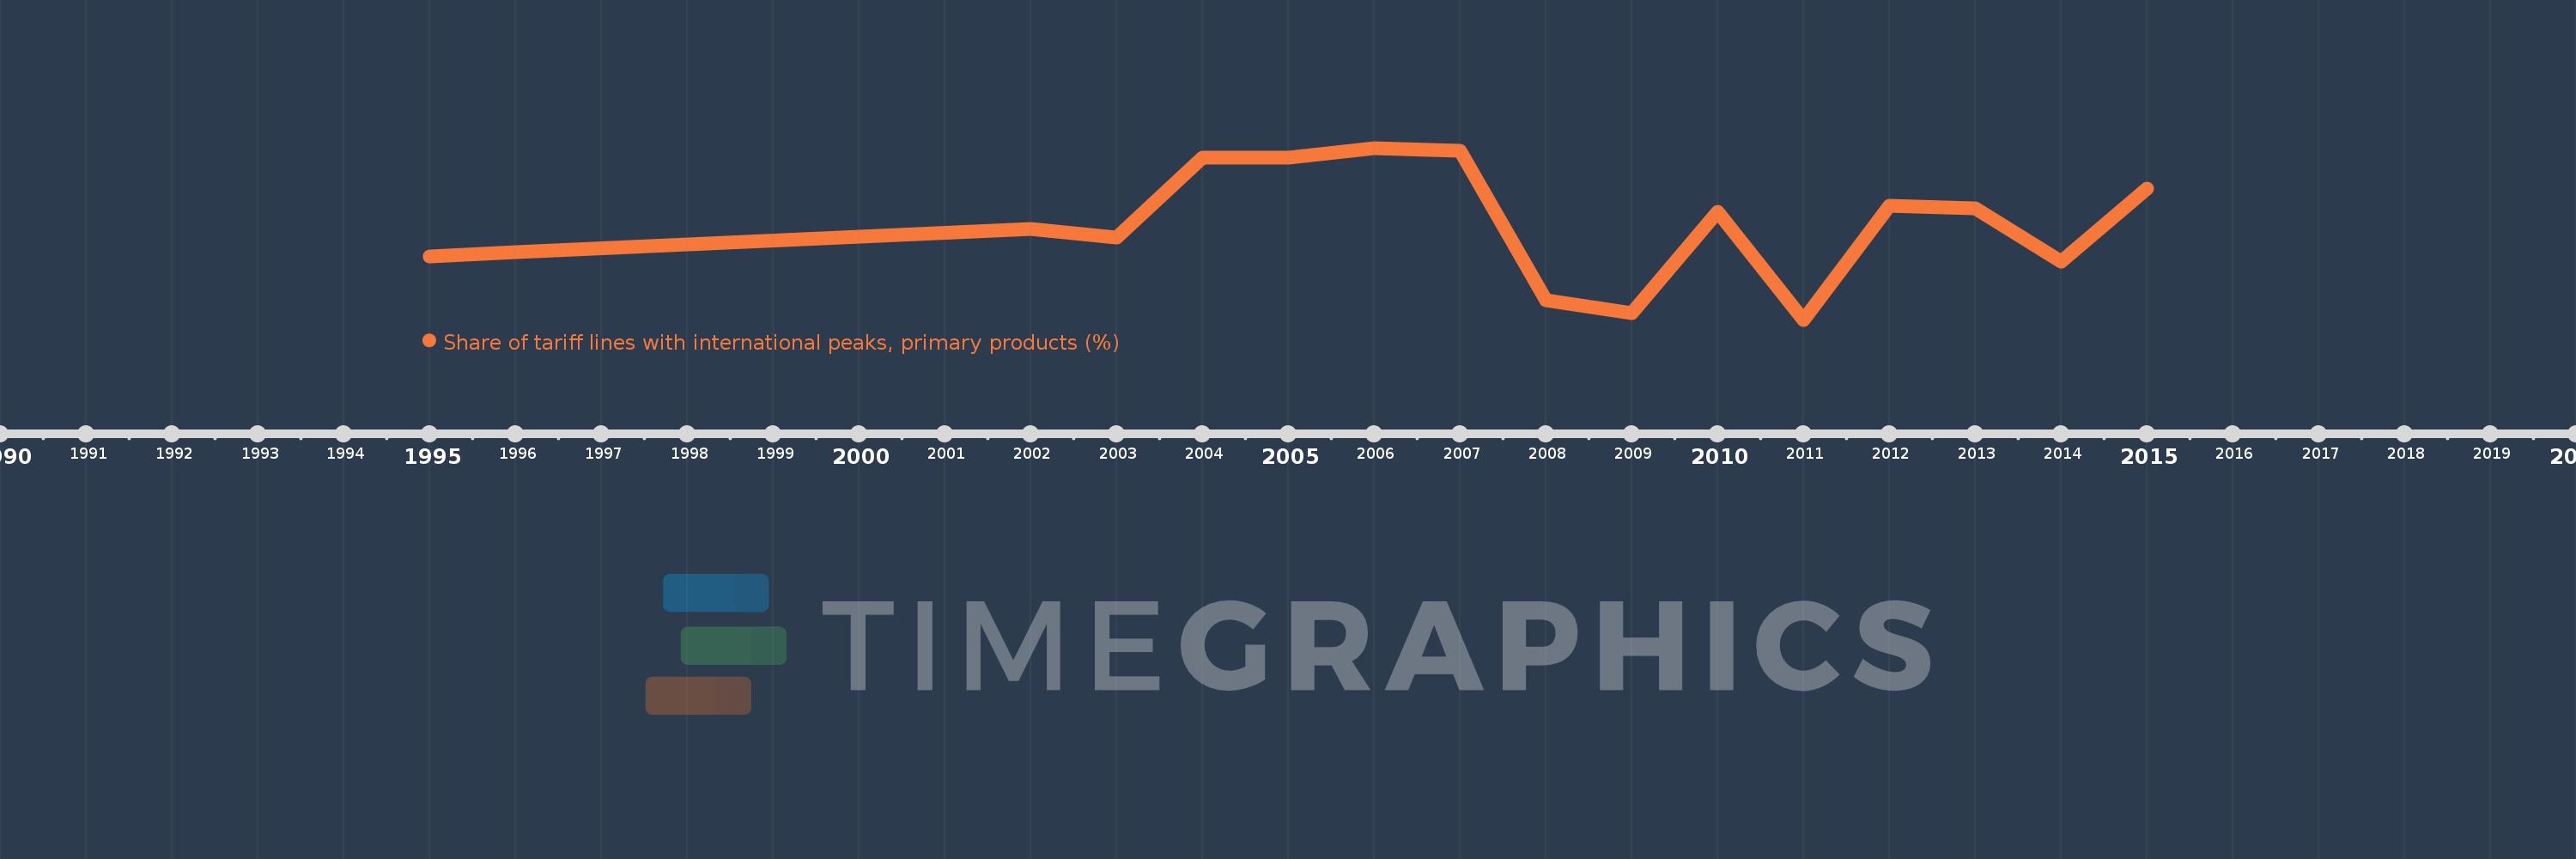
This timeline shows a graph from 1995 to 2015 of Cameroon. No data until 1994. Number of actual observations by date: 16.
Source name:
World Development Indicators
Source organization:
World Bank staff estimates using the World Integrated Trade Solution system, based on data from United Nations Conference on Trade and Development's Trade Analysis and Information System (TRAINS) database.
Categories, topics:
Private Sector, Trade
Last updated:
apr 23, 2017
Indicators value changes by year
Meaning:
59.757
Minimum:
52.214
jan 1, 2011
Maximum:
65.882
jan 1, 2006
At the date of observation
Value
Absolute change
Change from the previous value
jan 1, 1995
57.268
+57.268
0.0%
jan 1, 1996
57.561
+0.293
0.51%
jan 1, 2002
59.453
+1.892
3.29%
jan 1, 2003
58.729
-0.725
-1.22%
jan 1, 2004
65.125
+6.397
10.89%
jan 1, 2005
65.125
0.0
0.0%
jan 1, 2006
65.882
+0.757
1.16%
jan 1, 2007
65.678
-0.204
-0.31%
jan 1, 2008
53.735
-11.944
-18.18%
jan 1, 2009
52.715
-1.02
-1.9%
jan 1, 2010
60.796
+8.081
15.33%
jan 1, 2011
52.214
-8.582
-14.12%
jan 1, 2012
61.263
+9.049
17.33%
jan 1, 2013
61.095
-0.168
-0.27%
jan 1, 2014
56.842
-4.253
-6.96%
jan 1, 2015
62.63
+5.787
10.18%
Ranking of countries by current statistics by years