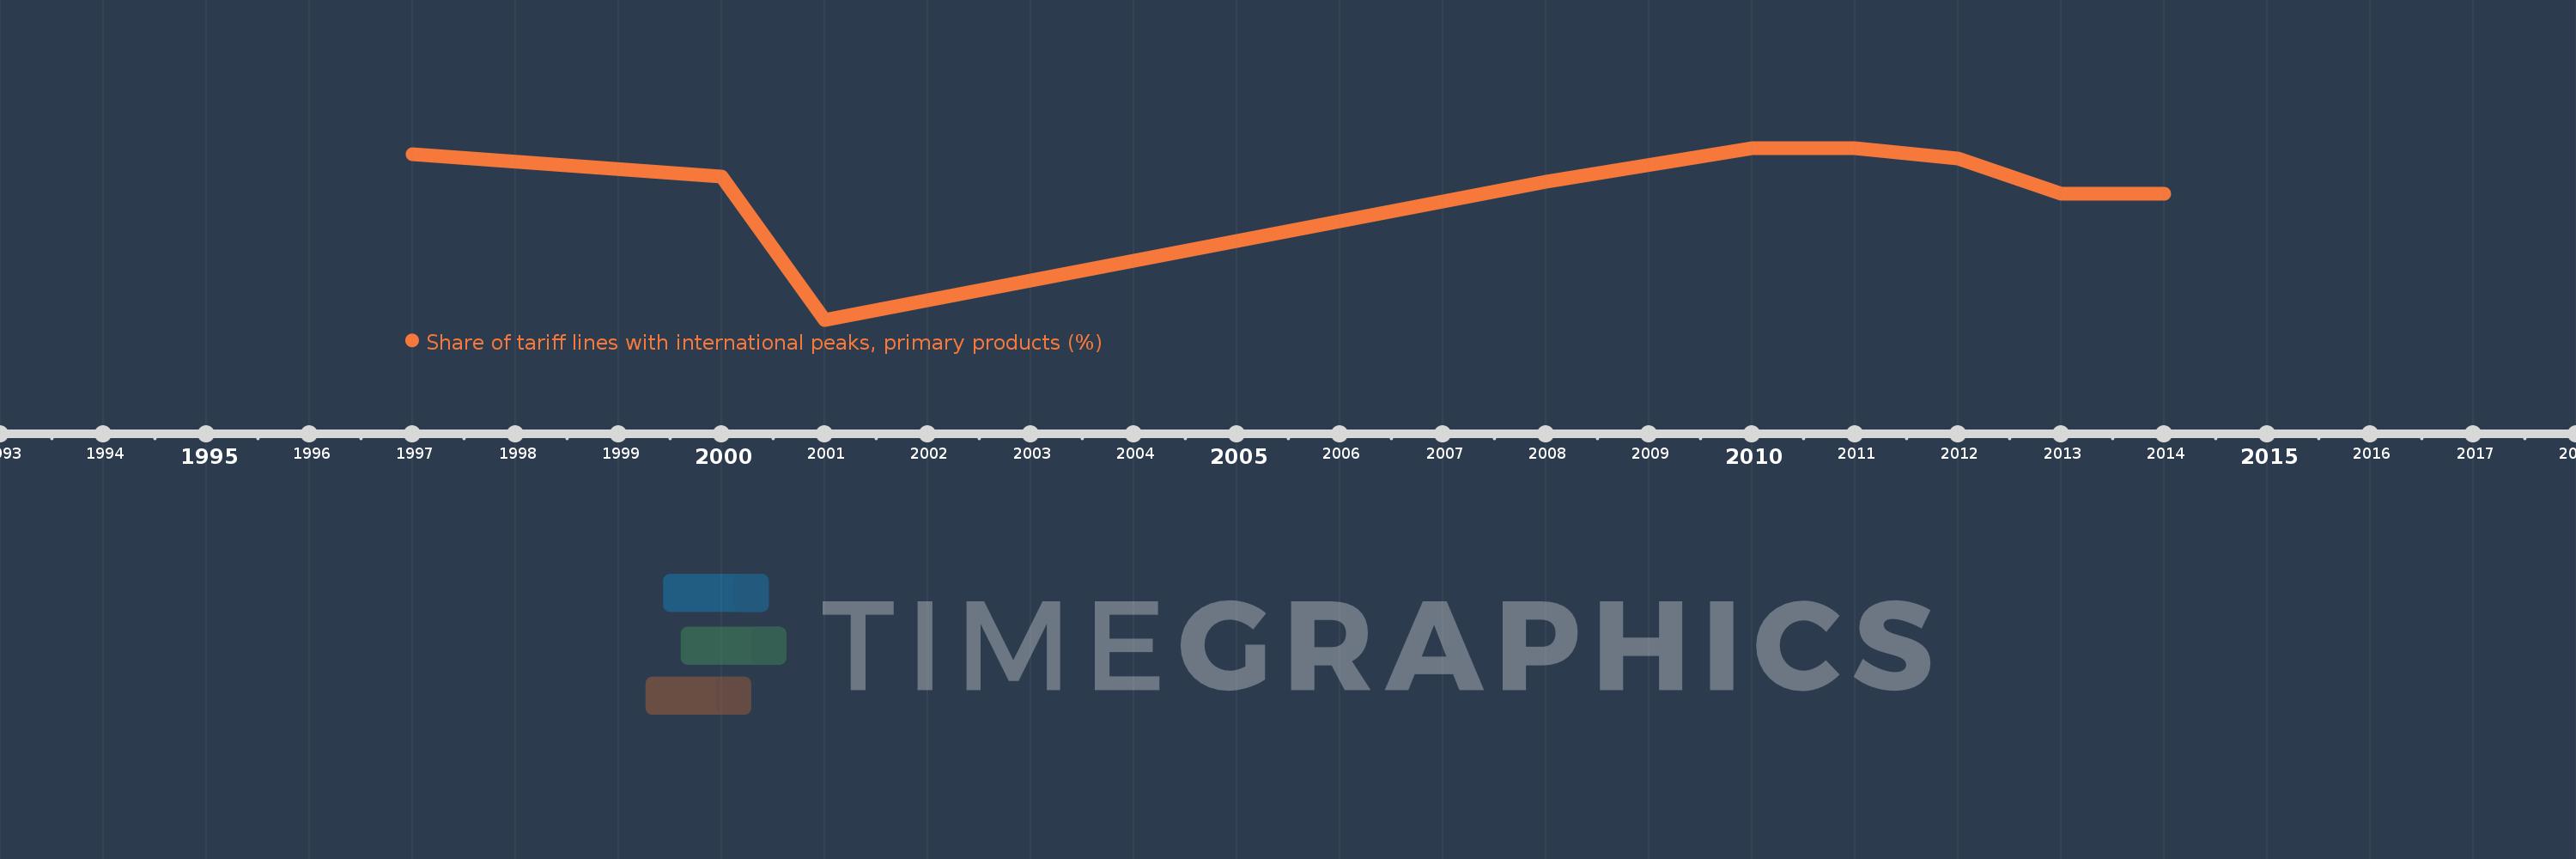
This timeline shows a graph from 1997 to 2014 of Suriname. No data until 1996. Number of actual observations by date: 9.
Source name:
World Development Indicators
Source organization:
World Bank staff estimates using the World Integrated Trade Solution system, based on data from United Nations Conference on Trade and Development's Trade Analysis and Information System (TRAINS) database.
Categories, topics:
Private Sector, Trade
Last updated:
apr 23, 2017
Indicators value changes by year
Meaning:
45.698
Minimum:
18.607
jan 1, 2001
Maximum:
53.441
jan 1, 2010
At the date of observation
Value
Absolute change
Change from the previous value
jan 1, 1997
52.105
+52.105
0.0%
jan 1, 2000
47.698
-4.407
-8.46%
jan 1, 2001
18.607
-29.091
-60.99%
jan 1, 2008
46.53
+27.923
150.07%
jan 1, 2010
53.441
+6.912
14.85%
jan 1, 2011
53.441
0.0
0.0%
jan 1, 2012
51.213
-2.228
-4.17%
jan 1, 2013
44.122
-7.091
-13.85%
jan 1, 2014
44.122
0.0
0.0%
Ranking of countries by current statistics by years