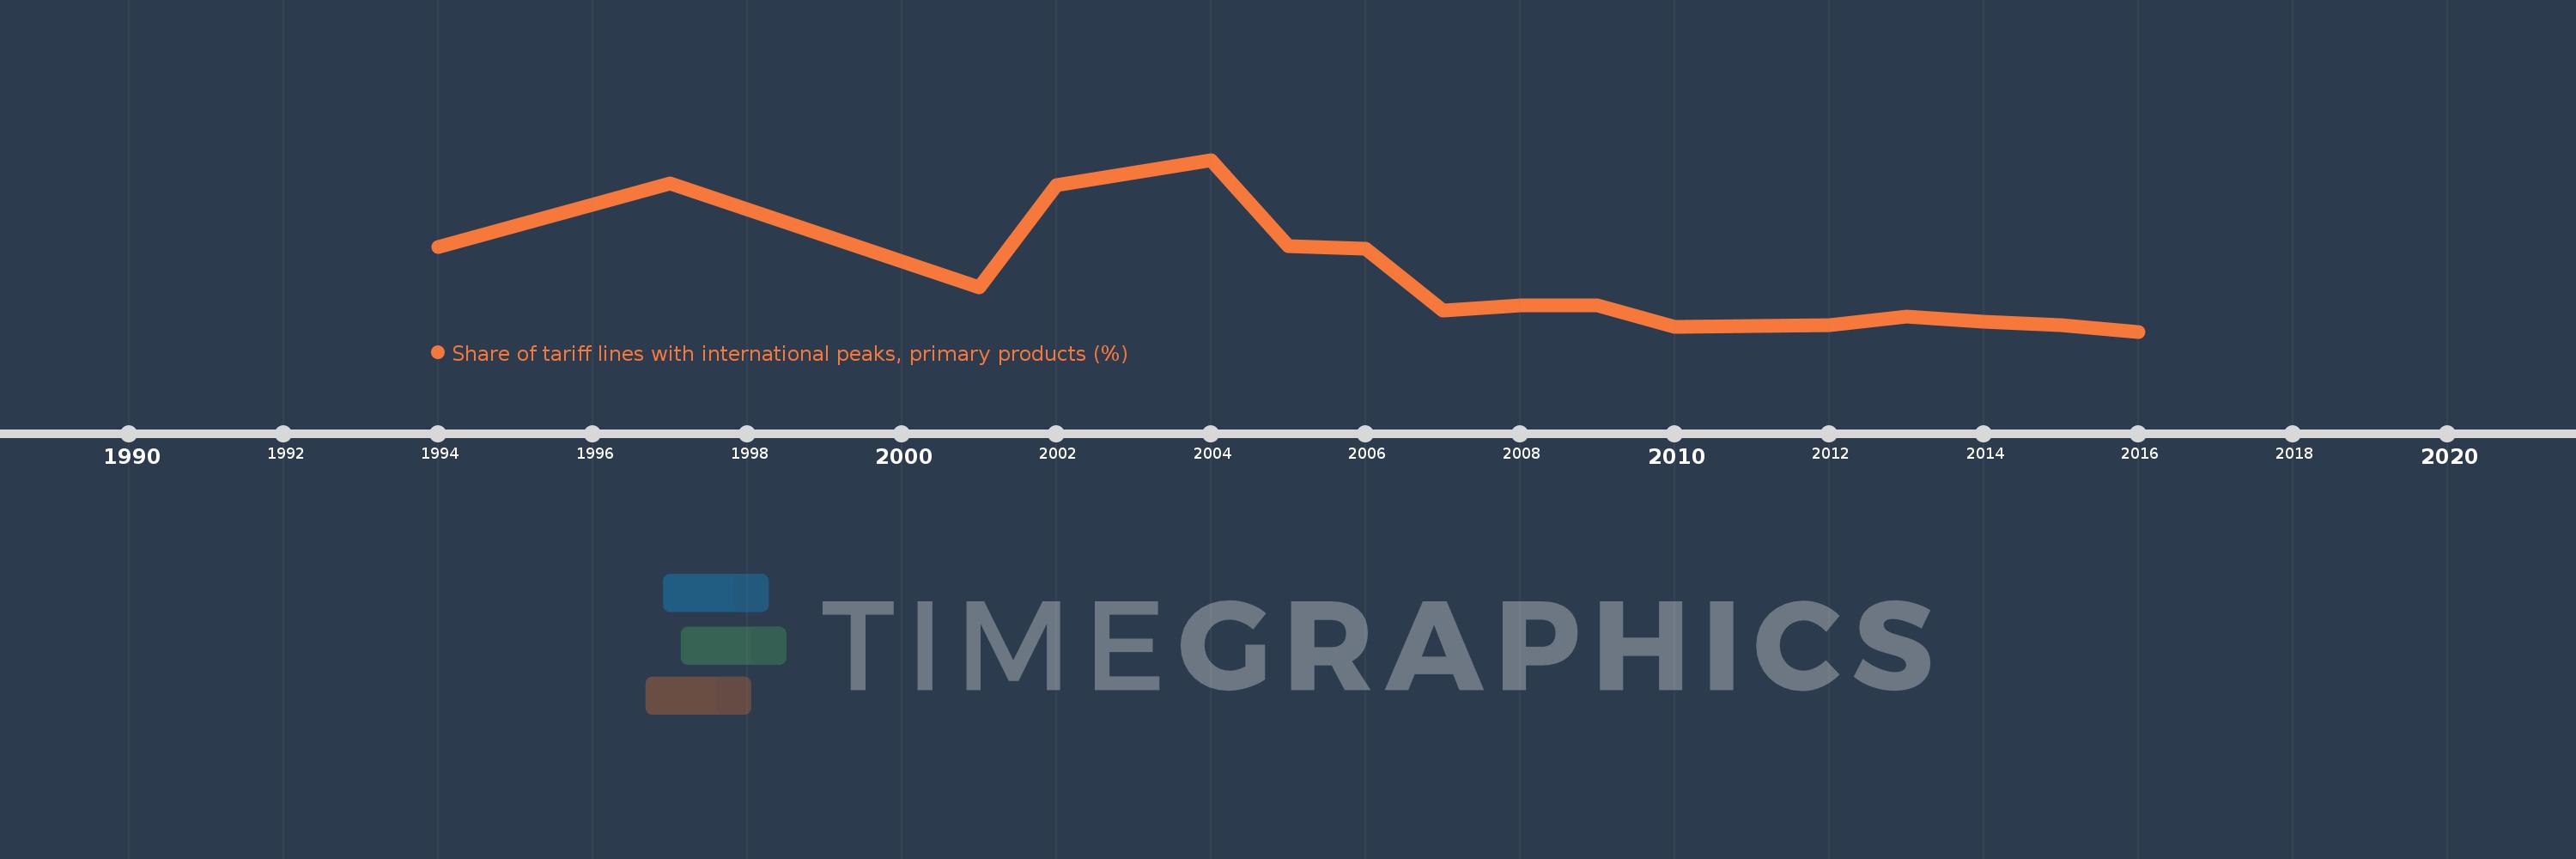
This timeline shows a graph from 1994 to 2016 of Iceland. No data until 1993. Number of actual observations by date: 17.
Source name:
World Development Indicators
Source organization:
World Bank staff estimates using the World Integrated Trade Solution system, based on data from United Nations Conference on Trade and Development's Trade Analysis and Information System (TRAINS) database.
Categories, topics:
Private Sector, Trade
Last updated:
apr 23, 2017
Indicators value changes by year
Meaning:
10.969
Minimum:
5.527
jan 1, 2016
Maximum:
23.515
jan 1, 2004
At the date of observation
Value
Absolute change
Change from the previous value
jan 1, 1994
14.37
+14.37
0.0%
jan 1, 1997
21.037
+6.667
46.4%
jan 1, 2001
10.121
-10.916
-51.89%
jan 1, 2002
20.84
+10.718
105.9%
jan 1, 2004
23.515
+2.676
12.84%
jan 1, 2005
14.442
-9.074
-38.59%
jan 1, 2006
14.187
-0.254
-1.76%
jan 1, 2007
7.736
-6.451
-45.47%
jan 1, 2008
8.288
+0.552
7.13%
jan 1, 2009
8.238
-0.049
-0.6%
jan 1, 2010
6.043
-2.195
-26.65%
jan 1, 2011
6.097
+0.054
0.89%
jan 1, 2012
6.211
+0.114
1.87%
jan 1, 2013
7.096
+0.885
14.25%
jan 1, 2014
6.548
-0.548
-7.73%
jan 1, 2015
6.173
-0.374
-5.72%
jan 1, 2016
5.527
-0.647
-10.48%
Ranking of countries by current statistics by years