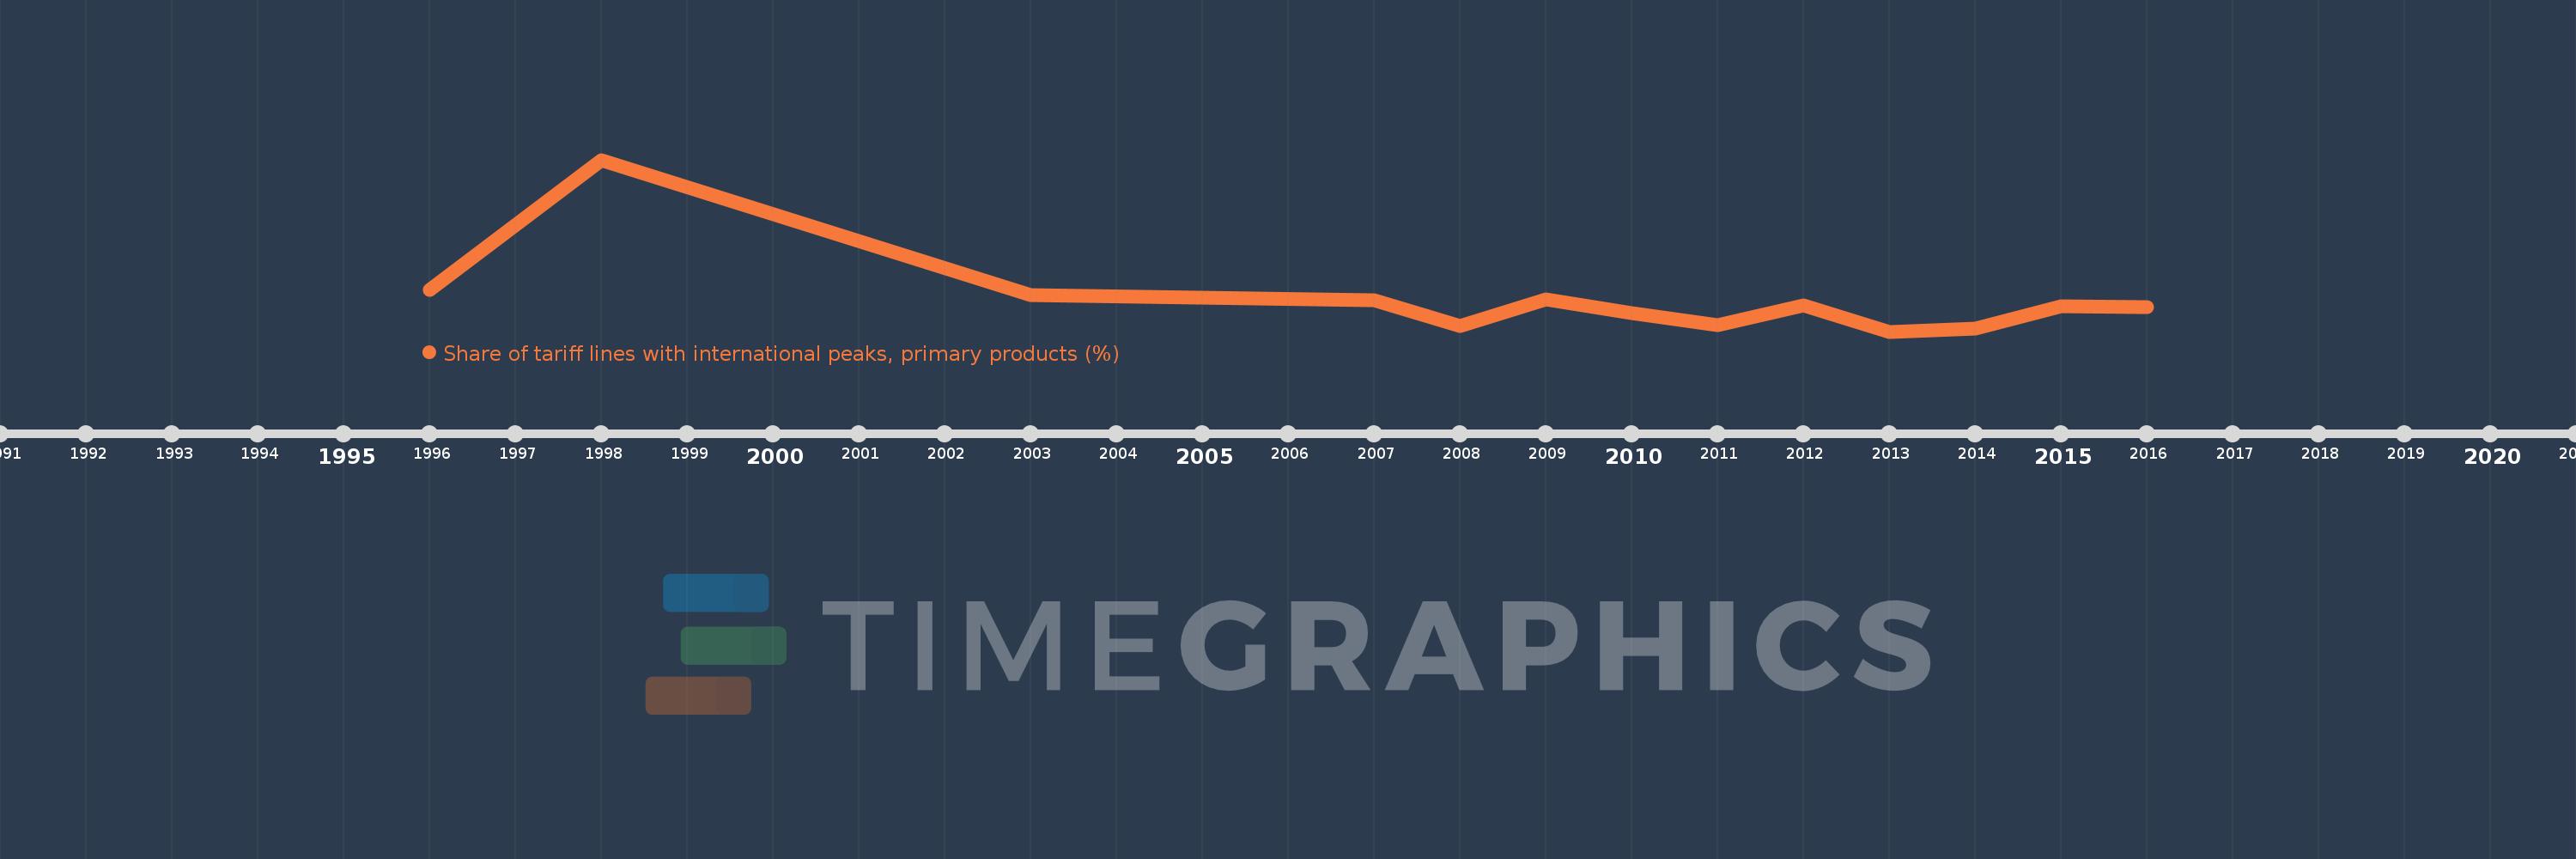
This timeline shows a graph from 1996 to 2016 of Ukraine. No data until 1995. Number of actual observations by date: 13.
Source name:
World Development Indicators
Source organization:
World Bank staff estimates using the World Integrated Trade Solution system, based on data from United Nations Conference on Trade and Development's Trade Analysis and Information System (TRAINS) database.
Categories, topics:
Private Sector, Trade
Last updated:
apr 23, 2017
Indicators value changes by year
Meaning:
13.166
Minimum:
5.089
jan 1, 2013
Maximum:
47.769
jan 1, 1998
At the date of observation
Value
Absolute change
Change from the previous value
jan 1, 1996
15.418
+15.418
0.0%
jan 1, 1998
47.769
+32.351
209.83%
jan 1, 2003
14.17
-33.6
-70.34%
jan 1, 2007
12.876
-1.293
-9.13%
jan 1, 2008
6.579
-6.297
-48.91%
jan 1, 2009
12.992
+6.413
97.48%
jan 1, 2010
9.682
-3.31
-25.48%
jan 1, 2011
6.626
-3.057
-31.57%
jan 1, 2012
11.59
+4.964
74.92%
jan 1, 2013
5.089
-6.501
-56.09%
jan 1, 2014
5.748
+0.659
12.96%
jan 1, 2015
11.375
+5.627
97.89%
jan 1, 2016
11.244
-0.131
-1.15%
Ranking of countries by current statistics by years